
Figures & data
Figure 1. Flow chart of study design and the main results. IBS: Iberian Population in Spain from 1000 Genomes Project.
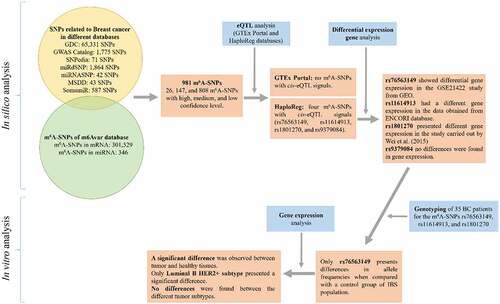
Table 1. List of identified m6A-SNPs associated with BC that presented cis-eQTL effect.
Table 2. Alleles and genotypes frequencies for the four m6A-SNPs in different populations. AFR: African; AMR: American; EAS: East Asian; EUR: European; and SAS: South Asian.
Figure 2. A graphical representation of the miRNA structure obtained from the UNAFold Web Server (http://www.unafold.org/mfold/applications/rna-folding-form.php) [Citation52]. The m6A-SNP rs11614913 (C/U) is found inside the red circle and it may influence the m6A modification of the complete DRACH motif (green boxes) and incomplete one (blue box). (a) Representation of the miRNA structure with the variant C for the m6A-SNP rs11614913. (b) Representation of the miRNA structure with the variant U for the m6A-SNP rs11614913.
![Figure 2. A graphical representation of the miRNA structure obtained from the UNAFold Web Server (http://www.unafold.org/mfold/applications/rna-folding-form.php) [Citation52]. The m6A-SNP rs11614913 (C/U) is found inside the red circle and it may influence the m6A modification of the complete DRACH motif (green boxes) and incomplete one (blue box). (a) Representation of the miRNA structure with the variant C for the m6A-SNP rs11614913. (b) Representation of the miRNA structure with the variant U for the m6A-SNP rs11614913.](/cms/asset/bfceb457-022a-415b-b9b7-3e7fa6b6dcd0/kepi_a_2111137_f0002_oc.jpg)
Table 3. Alleles and genotypes frequencies and χ2 test for the patients with BC and female from the IBS population. We took values of p < 0.05 as significant (indicated in bold in the table below).
Table 4. Average of relative gene expression for the m6A-SNP rs76563149 localized in ZNF354A gene with its standard deviation (SD) in the tumour breast tissue and its corresponding adjacent normal breast tissue and the p-values obtained for the Mann–Whitney U and Kruskal–Wallis H tests. We took p-values of <0.05 as significant, except in the Kruskal–Wallis H test, where a p-value of <0.005 was considered as significant (indicated in bold in the table below).
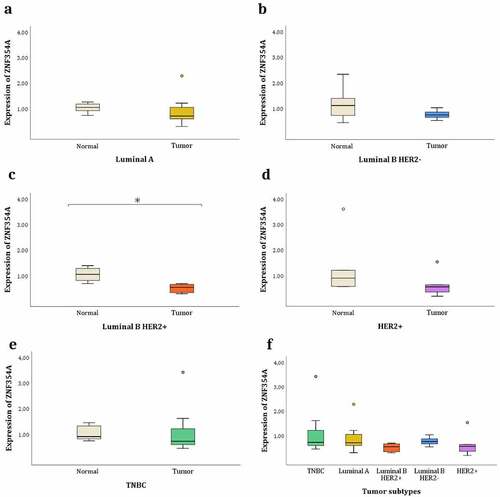
Figure 3. Relative expression levels of the ZNF354A gene. The fragment analysed contains the m6A-SNP rs76563149. Gene expression between each tumour subtype and its corresponding adjacent normal tissues: (a) TNBC. (b) Luminal A. (c) Luminal B HER2 +. (d) Luminal B HER2-. (e) HER2 +. (f) Gene expression between the different tumour subtypes. * P-value <0.05. The circles are outlier.
Supplemental Material
Download MS Word (12.2 KB)Data Availability Statement
The data that support the findings of this study are available from the corresponding authors, MMP and FO, upon request.