
Figures & data
Table 1. Characteristics of the 42 mother-infant dyads from the S1000 days cohort.
Figure 1. Global mean methylation of S1000 placenta samples. (a) Global mean methylation of placenta samples separated by sex of offspring and bar colours indicate GDM status. Error bars show standard deviation. (b) PCA plot of all queried CpGs (n = 989,582), colours indicate GDM status, shapes indicate sex, ellipses indicate 95% confidence intervals.
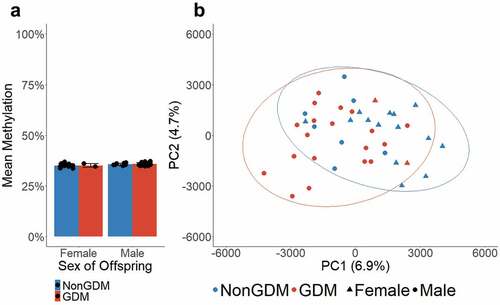
Figure 2. Genome-wide difference in GDM placental methylation status compared to non-GDM. (a) Proportion of total CpGs queried with no changes (unperturbed) vs. significant changes in methylation (DMCs) between GDM and non-GDM placentas; (b) Distribution of DMCs across the genome. Top graph shows number of DMCs (DMC count) localized to each chromosome. Bottom graph shows the ratio of observed/expected DMCs by chromosome; (c) Number of DMCs with effect size <10% vs. ≥10% (d) Proportion of DMCs with different effects sizes (<10% vs. ≥10%) on each chromosome.
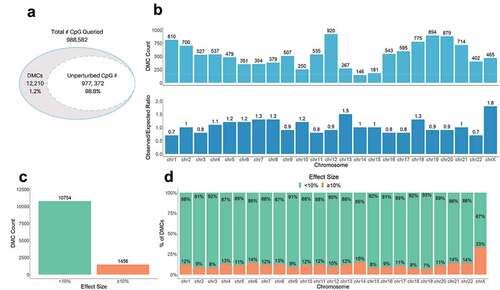
Figure 3. Sex-specific methylation levels of GDM-related large effect size DMCs (>20%) on chr X. Percent methylation at DMCs with effect sizes >20% on chr X. Mean % methylation shown for GDM vs nonGDM samples (red vs blue) stratified by sex (circle vs triangle). DMCs shown are not consecutive or drawn to scaled distance.
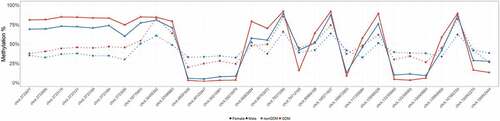
Figure 4. Genic location of DMCs. (a) Proportion of DMCs localized to each genic region shown. (b) Proportion of DMCs localized to each genic region separated by effect size <10% vs. ≥10%.
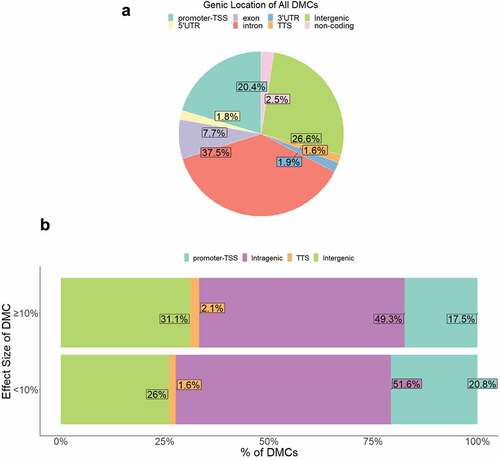
Figure 5. Sample methylation profiles at GDM-related DMCs using hierarchical clustering. (a) Hierarchical clustering of DMCs (n = 12,210) in all samples (n = 42); (b) Hierarchical clustering of DMCs with ≥10% effect size (n = 1,456) in all samples (n = 42); (c) Hierarchical clustering of DMCs (n = 12,210) in male samples (n = 26).
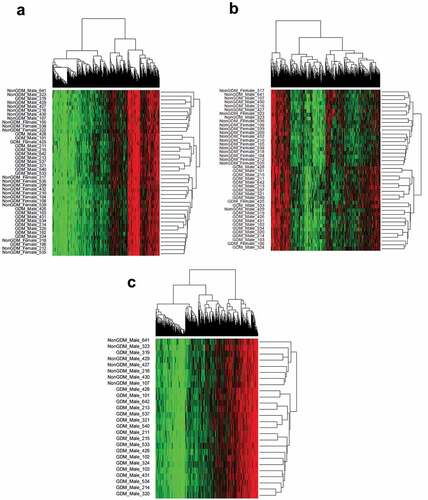
Table 2. Overrepresented PANTER pathways associated with DMCs.
Table 3. Summary of 14 candidate genes.
Figure 6. DMRs at eleven candidate genes of GDM-related placental injury. Line graphs show mean sample DNA methylation levels (± standard error of the mean, SEM) across consecutive DMCs for GDM (red) vs non-GDM (blue) samples (N = 42 total). Bar graphs show mean CpG methylation (± SEM) across the individual genic regions shown in the line graph for GDM vs. non-GDM samples. (a) Genes with higher regional promoter methylation levels in GDM samples: PDXK, SMOC2, and HIST1H3E; (b) Genes with lower regional promoter methylation levels in GDM samples: PPARGC1A and MKRN3; (c) Genes with higher regional exonic methylation in GDM samples: ADORA2B, IRS1, NTN1; (d) Genes with altered regional intronic methylation in GDM samples: EBF1, FGF18, PTPRN2; (e) Genes with altered consecutive DMCs but no significant mean regional change: ESX1, WNT2, GATA4. Asterisks indicate FDR<0.05 after correction by BH method.
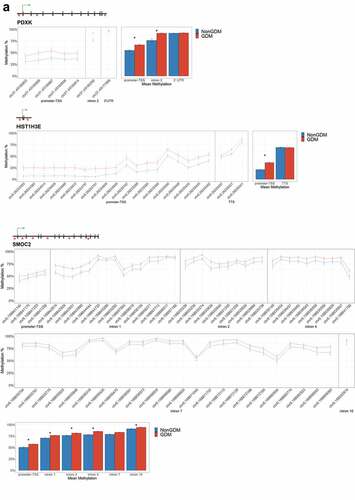
Figure 6. (Continued).
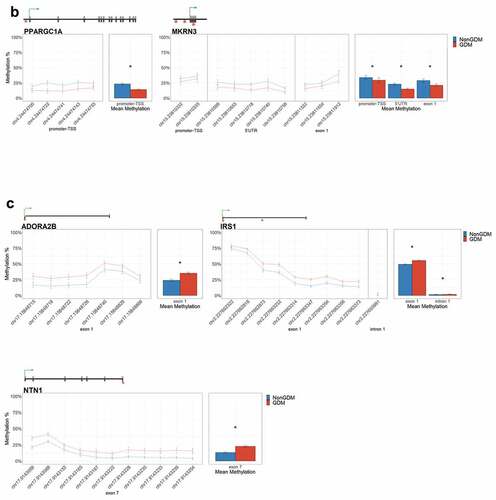
Figure 6. (Continued).
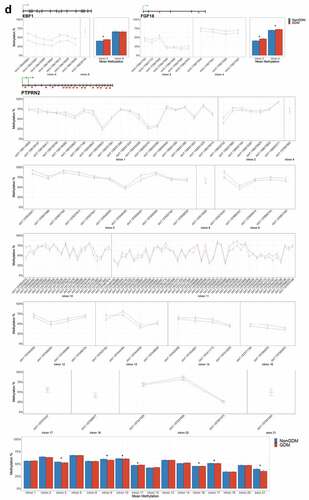
Figure 6. (Continued).
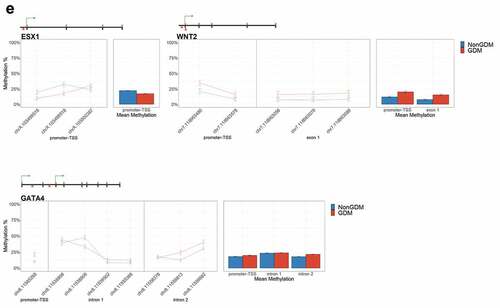
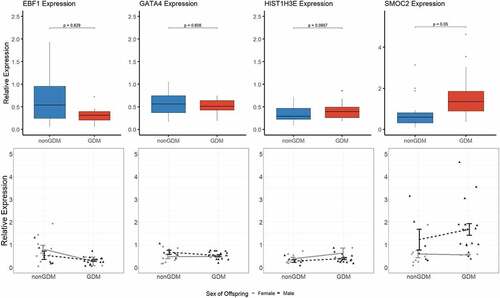
Figure 7. Candidate gene expression levels. Top panels show boxplots of the relative expression levels of four selected candidate genes, EBF1, GATA4, HIST1H3E, and SMOC2. P-values calculated by linear regression analyses with adjustment for maternal age, maternal BMI, sex of offspring, and gestational age. Bottom panels show individual methylation levels for each male (triangle) or female (circle) placenta sample (N = 36 total) and the line shows the difference in mean methylation (± SEM) of male (black line) GDM vs nonGDM samples (± SEM) or female (grey line) GDM vs non-GDM samples.
Supplemental Material
Download Zip (432.5 KB)Data availability statement
The datasets used during the study are currently available from the corresponding authors on reasonable requests. Data will be available within 6 months of the paper acceptance date at GEO through NCBI.