
Figures & data
Table 1. Participant characteristics with and without knee pain (n = 174).
Figure 1. Relationship between DNAmGrimAge-difference and brain-PAD (green = no pain, yellow = low impact pain, red = high impact pain).
Note: *P < 0.05. IV, independent variable; DV, dependent variable; GCPS, Graded Chronic Pain Scale.
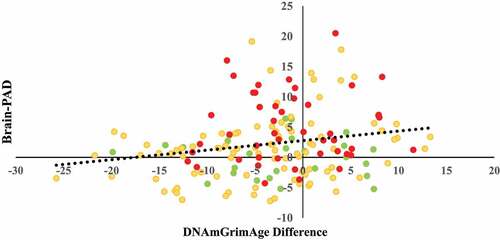
Figure 2. Mediation analysis of pain group, DNAmGrimAge-difference and brain-PAD. Bias corrected bootstrapped estimates and confidence intervals.
Table 2. Bias corrected bootstrapped estimates and confidence intervals for direct and mediated effects of pain severity and disability GCPS scores on brain-PAD adjusting for covariates.
Data availability statement
The data that support the findings of this study are available from the corresponding author upon reasonable request.