Figures & data
Figure 1. Identification of H3K27me3 target genes affected by maternal HFD (high fat diet) regulating embryonic skeletal development. (a) and (b) representing top 45 genes and significantly H3K27me3 enriched or decreased in gene body (including gene promoter) using Heat Map analysis of ChIP-seq data from foetal calvaria cells either from HFD or control diet dams (pooled three per group). (c) Bone related genes with at least a 1.5 fold significantly changed H3K27me3 enrichment, Con, control; HF, HFD, numbers are detected and aligned peak values. (d) Pthlh was significantly enriched in HFD group for H3K27me3 within the gene body, especially in the promoter region based on the detection of a peak of enrichment (indicated by rectangles) by Illumina DNA sequencing. (e) Real-time PCR for Pthlh mRNA expression in total RNA from foetal calvaria cells either from HFD or control diet dams (6 per group), * p < 0.05 by t-test. (f) Col2al was significantly enriched in HFD group for H3K27me3 within the gene body, especially in the promoter region based on the detection of a peak of enrichment (indicated by rectangles) by Illumina DNA sequencing. (g) Real-time PCR for Col2al mRNA expression in total RNA from foetal calvaria cells either from HFD or control diet dams (6 per group), * p < 0.05 by t-test.
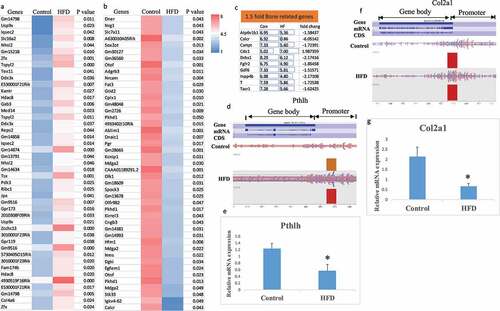
Figure 2. Maternal HFD enhances association of H3K27me3 with Pthlh, BMP6 and Col2al. (a) ChIP of foetal calvaria cells of mouse Pthlh, BMP6 and Col2al enhancer elements by specific anti H3K27me3 antibody. (b) ChIP of foetal calvaria cells of enrichments of Pthlh, BMP6 and Col2al after IP with H3K27me3 antibody. Fold enrichment relative to IgG. *, p < 0.05 by t-test HFD versus control diet dams.
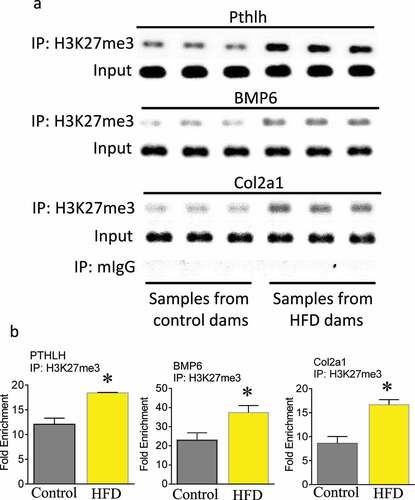
Figure 3. Identification of H3K27ac target genes affected by maternal HFD (high fat diet) regulating embryonic skeletal development. (a) and (b) representing top 45 genes significantly H3K27ac enriched or decreased in gene body (including gene promoter) using Heat Map analysis of ChIP-seq data from foetal calvaria cells either from HFD or control diet dams (pooled three per group). (c) Cell/tissue senescence related genes with at least a 1.5 fold significantly changed H3K27ac enrichment, Con, control; HF, HFD, numbers are detected and aligned peak values. (d) and (e) Tnfaip3 and Twist1 were significantly enriched in HFD group for H3K27ac within the gene body, especially in the promoter region based on the detection of a peak of enrichment (indicated by rectangles) by Illumina DNA sequencing. (f) Real-time PCR for Tnfaip3 and Twist1 mRNA expression in total RNA from foetal calvaria cells either from HFD or control diet dams (6 per group), * p < 0.05 by t-test. (g) Venn diagram shows 34 genes from foetal calvaria cells were significantly H3K27ac enriched and H3K27me3 enriched in their gene body or gene promoter by maternal HFD compared with maternal control diet.
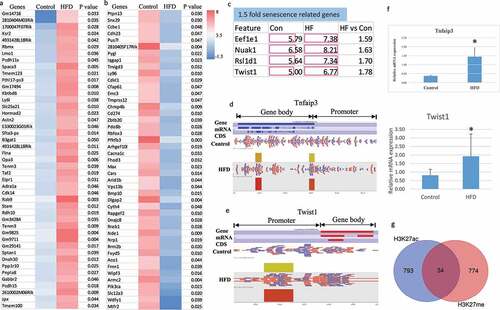
Figure 4. Maternal HFD enhances association of H3K27ac with Tnfaip3 and Twist1. (a) ChIP of foetal calvaria cells of mouse Tnfaip3 and Twist1 enhancer elements by specific anti H3K27ac antibody. (b) ChIP of foetal calvaria cells of enrichments of Tnfaip3 and Twist1 after IP with H3K27ac antibody. Fold enrichment relative to IgG. *, p < 0.05 by t-test HFD versus control diet dams. Immune-staining using Twist1 antibody on cryosectioned embryonic spine (c) and muscle tissue (d) from control diet or HFD dams.
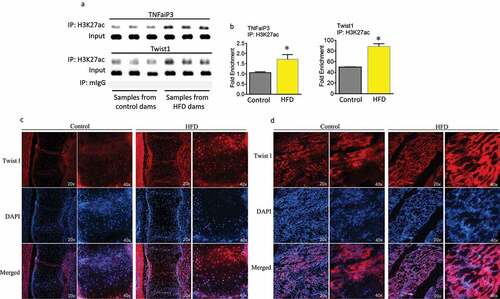
Figure 5. Identification of H3K27ac target genes affected by maternal and postnatal offspring HFD regulating bone development. (a) and (b) comparison of represented top 45 genes with significantly H3K27ac enriched or decreased in gene body (including gene promoter) using Heat Map analysis of ChIP-seq data from offspring mouse spine L4 born to control diet dams with offspring control diet (CC) and to HFD dams with offspring control diet (HC) (pooled three per group). (c) and (d) comparison of represented top 45 genes with significantly H3K27ac enriched or decreased in gene body (including gene promoter) using Heat Map analysis of ChIP-seq data from offspring mouse spine L4 born to control diet dams with offspring control diet (CC) or to HFD dams with offspring HFD (HH) (pooled three per group).
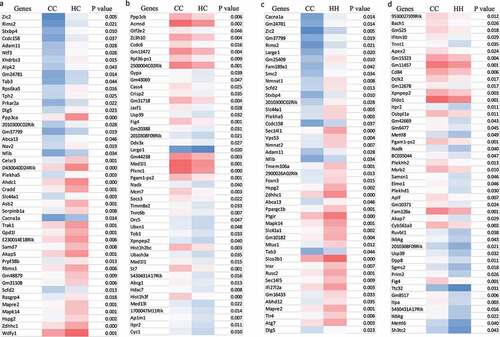
Figure 6. Comparison of H3K27ac target genes affected by maternal and postnatal offspring HFD regulating bone development. (a) representative significantly 1.5 fold changes of bone related genes subset from overall 1.5 fold different genes with H3K27ac enriched or decreased in gene body (including gene promoter) from all four groups, CC, control diet dams with offspring control diet; CH, control diet dams with offspring HFD; HC, HFD dams with offspring control diet; HH, HFD dams with offspring HFD (pooled three per group). (b) Venn diagram shows 10 genes were overlapped from offspring mouse spine L4 with significantly H3K27ac enriched in their gene body or gene promoter by maternal or offspring HFD or both maternal and offspring HFD. (c) Venn diagram shows 5 genes were overlapped from offspring mouse spine L4 and foetal calvaria cells with significantly H3K27ac and H3K27me3 enriched in their gene body or gene promoter by maternal HFD with offspring control diet (CH vs CC) and maternal HFD (HF vs Con). (d) Venn diagram shows 5 genes were overlapped from foetal calvaria cells with significantly H3K27ac and offspring mouse spine L4 with H3K27ac enriched in their gene body or gene promoter by maternal HFD.
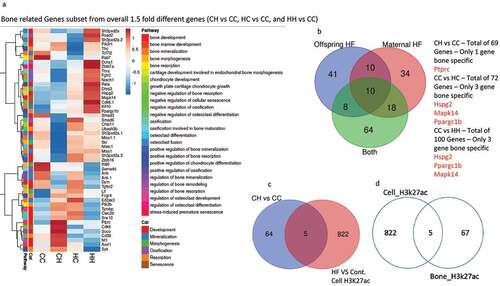
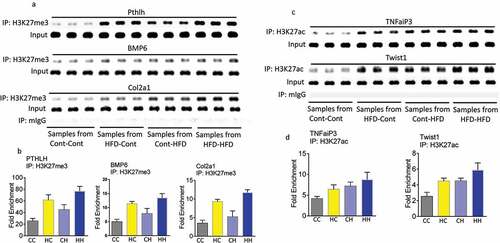
Figure 7. Maternal HFD enhances association of H3K27me3 with Pthlh, BMP6 and Col2al, and enhances association of H3K27ac with Tnfaip3 and Twist1 in offspring mouse spine L4. (a) ChIP of offspring mouse spine L4 of mouse Pthlh, BMP6 and Col2al enhancer elements by specific anti H3K27me3 antibody from four groups, Cont-Cont, dam control diet with offspring control diet; HFD-Cont, dam HFD with offspring control diet; Cont-HFD, dam control diet with offspring HFD; HFD-HFD, dam HFD with offspring HFD. (b) ChIP of offspring mouse spine L4 of enrichments of Pthlh, BMP6 and Col2al after IP with H3K27me3 antibody. Fold enrichment relative to IgG. (c) ChIP of offspring mouse spine L4 of mouse TNFaiP3 and Twist1 enhancer elements by specific anti H3K27ac antibody. (b) ChIP of offspring mouse spine L4 of enrichments of TNFaiP3 and Twist1 after IP with H3K27ac antibody. Fold enrichment relative to IgG.