
Figures & data
Table 1. Summary of DMR methods.
Table 2. Summary of DMR Implementations.
Table 3. Summary of Relative Computation Burden.
Figure 1. The Genome-wide False Positive Rates on 450 K-Mono: a. Normal Phenotype, b. Dichotomous Phenotype with 50% Cases, C. Skewed Continuous Phenotype.
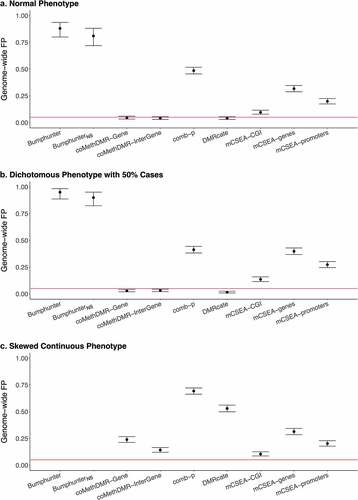
Figure 2. The Genome-wide False Positive Rates on EPIC-WB: a. Normal Phenotype, b. Dichotomous Phenotype with 50% Cases, C. Skewed Continuous Phenotype.
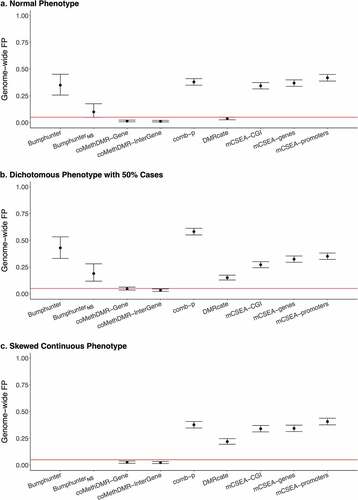
Figure 3. The Genome-wide False Positive Rates on 450 K-WB: a. Normal Phenotype, b. Dichotomous Phenotype with 50% Cases, C. Skewed Continuous Phenotype.
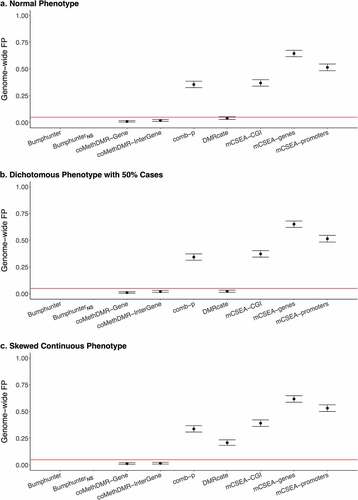
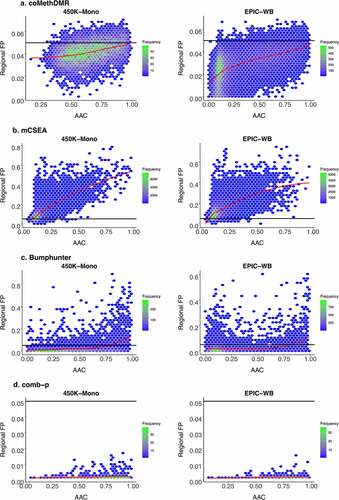
Figure 4. Regional False Positive Rates vs Average Absolute Pairwise Correlations on 450 K-Mono and EPIC-WB for the Normal Phenotype with Overall Trend Indicated by a Loess Curve in Red: A. coMethDMR, B. mCSEA, C. Bumphunter, D. comb-p.
Supplemental Material
Download MS Word (1.5 MB)Data Availability Statement
The GEO data GSE56046 that support the findings of this study are openly available in the MESA Epigenomics and Transcriptomics Study at https://www.ncbi.nlm.nih.gov/geo/query/acc.cgi?acc=GSE56046.
Qualified investigators can apply to the PTSD Genetics (NCPTSD) and TRACTS data repositories to gain access to these data via a Data Use Agreement. Please contact Drs. Miller and McGlinchey regarding access to PTSD Genetics and TRACTS data repositories, respectively.