
Figures & data
Table 1. Saccharomyces cerevisiae strains.
Figure 1. Effects of histone H3-L61R and two other H3-L61 mutants on Spt16 occupancy across three transcribed genes when expressed in conjunction with wild-type histone H3. (a) Diagrams of the three genes tested in these assays, shown roughly to scale. Numbers above the genes represent base-pair positions starting with the first base-pair of the respective open reading frame analysed. The numbers and coloured bars below the diagrams indicate the locations of the 5’ and 3’ regions amplified in qPCR experiments. Arrows indicate the direction of transcription. (b) Levels of Spt16 occupancy across the PMA1, FBA1, ADH1 genes as measured in ChIP/qPCR assays in strains expressing the indicated histone H3 proteins. All strains express wild-type histone H3 from the HHT1 locus and either wild-type histone H3 or the indicated H3-L61 mutant from the HHT2 locus – the H3WT/H3∆ control strain is deleted for the HHT2 locus. For each gene tested, Spt16 occupancy level at the 3’ region is shown relative to Spt16 binding at the respective 5’ end (see for Spt16 % immunoprecipitation values at the 5’ regions). In each case, data are presented as mean ± S.E.M. from three independent experiments. Statistically significant differences relative to H3 WT/H3 WT cells are indicated by asterisks (Student’s t-tests, P < 0.05). The strains used in these experiments are yADP127-yADP131.
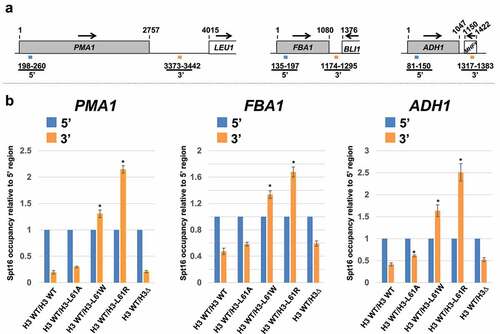
Table 2. Average Spt16 % immunoprecipitation (%IP) values at 5’ regions of genes assayed in this study.
Figure 2. Growth tests assessing dominant effects of H3-L61 mutants on phenotypes indicative of chromatin and transcription defects. Cells expressing the indicated histone H3 proteins were spotted on the indicated growth media in a 10-fold dilution series (6 μl per spot, with the cell concentration of the most concentrated spots at 5 × 10⁸ cells/ml). Media in the upper row contain glucose, whereas those on the bottom contain galactose – the FL08:HIS3 fusion gene is under the control of the GAL1 promoter, and cryptic transcription intragenic transcription initiation in H3 WT/H3-L61R cells is only seen in conditions that activate expression of the fusion gene (i.e., in the presence of galactose). Plates were incubated at 30°C for 2 days (SC), 3 days (SC-lys, SC GAL, and SC-his GAL), or 4 days (SC-his). The strains used for these assays are yADP134-138.
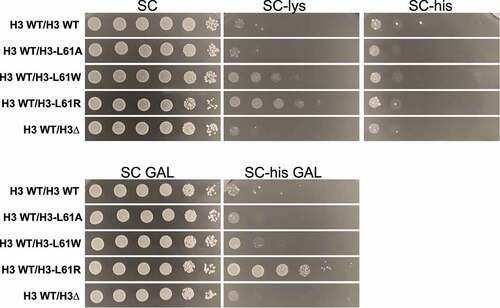
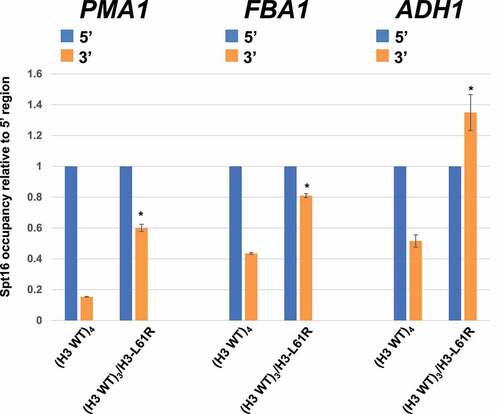
Figure 3. Effects of histone H3-L61R on Spt16-gene interactions when expressed from one of four histone H3-encoding alleles in diploid cells. Spt16 occupancy in diploid cells harbouring either a full set of wild-type histone H3-encoding alleles ((H3 WT)4) or three wild-type alleles and one encoding H3-L61R ((H3 WT)3/H3-L61R)) was assessed by ChIP/qPCR at the same regions as those assayed in . For each gene tested, Spt16 occupancy level at the 3’ region is shown relative to Spt16 binding at the respective 5’ end (see for Spt16 % immunoprecipitation values at the 5’ regions). In each case, data are presented as mean ± S.E.M. from three independent experiments. Statistically significant differences relative to (H3 WT)4 cells are indicated by asterisks (Student’s t-tests, P < 0.05). The strains used in these experiments are yADP132 and yADP133.
Supplemental Material
Download MS Power Point (54.9 KB)Data availability statement
The authors confirm that the data supporting the findings of this study are available within the article.