
Figures & data
Figure 1. Schematic representation of the classification of differentially methylated cytosines in either potentially additive, overdominant or underdominant in the hybrids compared to the parental species. Asterisks represent significant differential methylation between groups.
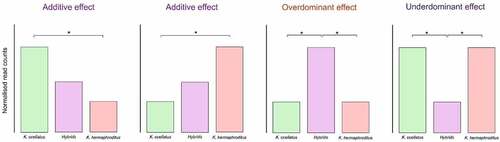
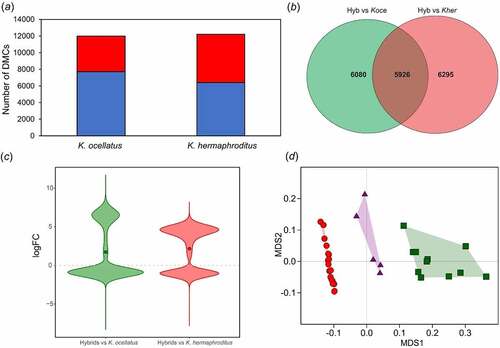
Figure 2. Cytosine methylation comparisons between parental species and F1hybrids. (a) Number of differentially methylated cytosines (DMCs) in K. ocellatus and K. hermaphroditus compared to their hybrids. Hypomethylated (logFC value > 1 in blue) and hypermethylated (logFC value < 1 in red) DMCs in comparison to hybrids are shown in blue and red, respectively. (b) Overlap in the number of DMCs of K. ocellatus and K. hermaphroditus in comparison with their hybrids. (c) Direction of changes of the common 5,926 DMCs in the comparisons among hybrids vs parental species. logFC values represent the intensity of changes compared to the hybrid values. logFC > 1 indicates higher CPM read counts (hypomethylation) in the hybrids compared to one of the parental species. logFC < 1 indicates lower CPM read counts (hypermethylation) in the hybrids compared to one of the parental species. Circles represent the mean for each comparison. (d) Multidimensional scaling analyses of the normalized counts for the 38,473DMCs between parental species. Green squares represent K. ocellatus, red circles represent K. hermaphroditus, and triangles represent the F1 hybrids.
Supplemental Material
Download MS Word (579.1 KB)Data availability statement
FastaQC files for GBS library can be accessed at NCBI (accession PRJNA563625). Sequence and microsatellite data are available in Supplementary Material of Berbel-Filho et al. (2021)41. https://github.com/waldirmbf/BerbelFilho_etal_KryptolebiasHybridisation/tree/master/1.ProcessingSequencingFiles/1.2.EpigeneticAnalysis.