
Figures & data
Figure 1. Flowchart of profile for the study participants.
Figure 2. Map of Kabwe showing the 13 health centres (yellow blocks) that were included in the study. The dashed oval-shaped line showed the Pb-polluted area (as exposed area) and outside is Pb-unpolluted area (as control area).
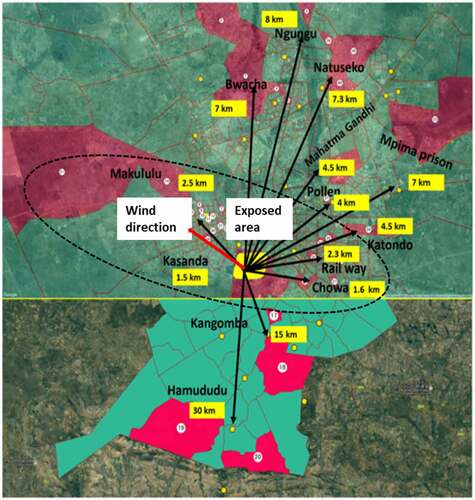
Table 1. Primer sequences used for the analysis.
Table 2. Characteristics of study subjects and blood Pb levels (µg/dL) for exposed (n = 123) and control (n = 63) children enrolled for this study, July-August 2017.
Table 3. Mixed-effects regression analysis of LINE-1 methylation level with blood Pb level and characteristics of the study subjects.
Figure 3. LINE-1 methylation level (%) in whole blood (a) by Pb exposure quartiles and (b) relationship with blood Pb level quartiles. *p < 0.05; Wilcoxon rank-sum test between LINE-1 methylation levels and blood Pb quartile levels.
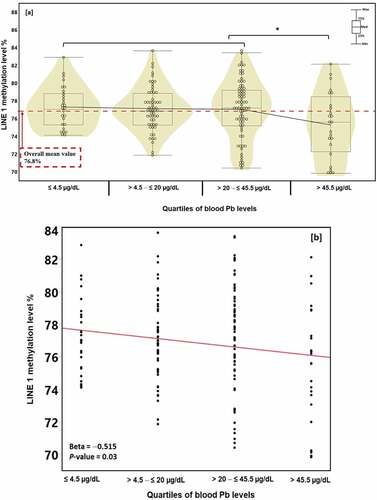
Figure 4. GSTP1 promoter’s methylation levels in whole blood and adjusted odd ratios (a) per area [control area: >3 km far away from the mine site; exposed area: within 3 km of the mine area and windward direction] and (b) per gender. PMR: percent methylation reference; solid bars indicate mean (m), and median (m) within a group of children; #indicates samples with PMR values ≤ 0.01. [a]: adjusted for age, gender, and BMI: [b]: adjusted for area and BMI.
![Figure 4. GSTP1 promoter’s methylation levels in whole blood and adjusted odd ratios (a) per area [control area: >3 km far away from the mine site; exposed area: within 3 km of the mine area and windward direction] and (b) per gender. PMR: percent methylation reference; solid bars indicate mean (m), and median (m) within a group of children; #indicates samples with PMR values ≤ 0.01. [a]: adjusted for age, gender, and BMI: [b]: adjusted for area and BMI.](/cms/asset/0da73f16-6acf-4ff4-acdb-db67a0df5d90/kepi_a_2123924_f0004_b.gif)