
Figures & data
Figure 1. Cohort construction of the 411 mother-infant pairs with placental epigenetic data, outlying observations (N = 3), where epigenetic Gestational Age (eGA) acceleration estimates were greater than three standard deviations from the mean, were excluded. The remaining 408 mother-infant pairs, included in the present analysis, had primarily white (N = 246) and Black (N = 115) mothers.
Table 1. Selected baseline characteristics of study population (N = 408), Extremely Low Gestational Aged Newborns (ELGAN). ELGAN study participants were recruited from one of 14 participating sites before 28 weeks gestation (2002–2004).
Table 2. Distribution of RPC-estimated eGA acceleration (weeks) in relation to sociodemographic factors. Distributions are summarized overall and across white and black race. P-values calculated from Welch Two-Sample T-tests (marital status) and ANOVA tests (other variables).
Figure 2. Relationship between Robust Placental Clock (RPC)-estimated placental epigenetic Gestational Age (eGA) and chronological gestational age. Mean absolute error (MAE) represents the median absolute difference between predicted and observed gestational age, and r and p are the Spearman correlation coefficient and p-value, respectively, of the association between observed gestational age and predicted eGA.
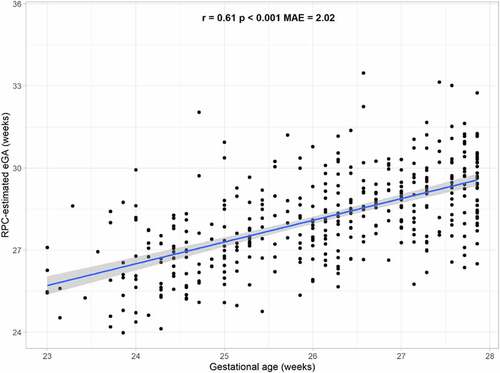
Table 3. Mean difference in RPC-estimated eGA acceleration (weeks) in relation to sociodemographic factors. Mean differences represent those observed overall and according to white and Black race.
Figure 3. Distribution of epigenetic Gestational Age (eGA) acceleration according to smoking status (a) overall and across mothers racialized as (b) Black and (c) white. Active or active + passive smoking was associated with a mean +0.50-week (95% CI: 0.23 to 0.77) and +0.89-week (95% CI: 0.38 to 1.40) accelerated placental eGA overall and among Mothers racialized as Black, respectively.
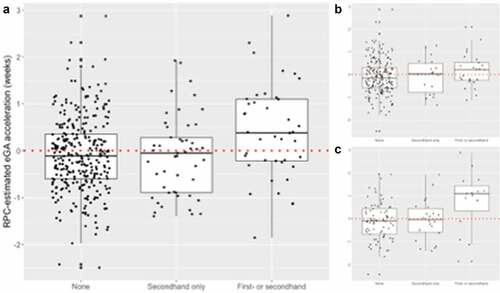
Table 4. Associations between chronological gestational age and RPC-estimated epigenetic age acceleration with clinical outcomes. Associations represent those observed overall and according to white and Black race.
Supplemental Material
Download Zip (536.6 KB)Data availability statement
Clinical or survey data except for outcomes at 15 y are available by completing the NINDS Data Request Form, which is available from Archived Clinical Research Datasets (https://www.ninds.nih.gov/sites/default/files/sig_form_revised_508c.pdf) and sending the completed form to [email protected]. The 15 y data can be obtained when the NIH ECHO Program releases a public use dataset, which is anticipated in 2022. DNA methylation data (GSE167885) for the ELGAN cohort is hosted on the Gene Expression Omnibus at the National Center for Biotechnology Information (https://www.ncbi.nlm.nih.gov/).