Figures & data
Figure 1. Reannotation of the 850k bead chip: (a) Barplot of the number of 850k-assessed cytosines associated with ‘enhancer,’ ‘dual,’ ‘promoter,’ ‘gene body,’ and ‘intergenic’ regions using ENCODE-based (orange) and Illumina default (blue) annotations The ENCODE-based annotation shows better coverage of all regulatory regions (‘Enhancer,’ ‘Dual,’ and ‘Gene Body’) except ‘Promoter’ regions (see the * mark), (probably because of an imprecise promoter definition in the Illumina default annotation). Top: lollipop scheme of the assessed regions. Cytosines are represented as white lollipops. The scheme shows two example cell types. Enhancers and promoters, identified through ENCODE chromatin state segmentation, are shown, respectively, in medium grey and dark grey. The gene body is represented in light grey. ‘Enhancer’ and ‘Promoter’ regions are defined as regions where only enhancers or promoters, respectively, can be identified through ENCODE chromatin states across all investigated cell lines. ‘Dual’ regions are associated with a promoter in some cell lines and with an enhancer in others. The TSS is represented as an arrow. (b) Barplot of percentages of probes associated with promoters by the Illumina annotation but not the ENCODE-based annotation as a function of distance to TSS. The grey bars represent percentages of probes showing a discrepancy between the Illumina and ENCODE-based annotations within a 200-bp window based on distance to the TSS. The blue region represents distance to TSS where the discrepancy is lower than 30%. The four promoter-associated regions (according to Sandoval et al [Citation49]) are shown as a scheme at the top of the figure: TSS200 (light grey), TSS1500 (medium grey), 5’ UTR and 1st Exon (dark grey). The TSS position is specified by a vertical line in the barplot and as an arrow in the scheme. (c) Barplot of the percentage of transcripts associated with at least one 850k-targeted cytosine, according to the reference annotation (Illumina default left, ENCODE-based right) and transcriptomic database (LNCipedia light grey, Ensembl dark grey).
![Figure 1. Reannotation of the 850k bead chip: (a) Barplot of the number of 850k-assessed cytosines associated with ‘enhancer,’ ‘dual,’ ‘promoter,’ ‘gene body,’ and ‘intergenic’ regions using ENCODE-based (orange) and Illumina default (blue) annotations The ENCODE-based annotation shows better coverage of all regulatory regions (‘Enhancer,’ ‘Dual,’ and ‘Gene Body’) except ‘Promoter’ regions (see the * mark), (probably because of an imprecise promoter definition in the Illumina default annotation). Top: lollipop scheme of the assessed regions. Cytosines are represented as white lollipops. The scheme shows two example cell types. Enhancers and promoters, identified through ENCODE chromatin state segmentation, are shown, respectively, in medium grey and dark grey. The gene body is represented in light grey. ‘Enhancer’ and ‘Promoter’ regions are defined as regions where only enhancers or promoters, respectively, can be identified through ENCODE chromatin states across all investigated cell lines. ‘Dual’ regions are associated with a promoter in some cell lines and with an enhancer in others. The TSS is represented as an arrow. (b) Barplot of percentages of probes associated with promoters by the Illumina annotation but not the ENCODE-based annotation as a function of distance to TSS. The grey bars represent percentages of probes showing a discrepancy between the Illumina and ENCODE-based annotations within a 200-bp window based on distance to the TSS. The blue region represents distance to TSS where the discrepancy is lower than 30%. The four promoter-associated regions (according to Sandoval et al [Citation49]) are shown as a scheme at the top of the figure: TSS200 (light grey), TSS1500 (medium grey), 5’ UTR and 1st Exon (dark grey). The TSS position is specified by a vertical line in the barplot and as an arrow in the scheme. (c) Barplot of the percentage of transcripts associated with at least one 850k-targeted cytosine, according to the reference annotation (Illumina default left, ENCODE-based right) and transcriptomic database (LNCipedia light grey, Ensembl dark grey).](/cms/asset/cce2ce5d-d04c-4578-a894-ff1fd2894f8a/kepi_a_2135201_f0001_oc.jpg)
Figure 2. Coverage of the 850k bead chip as compared to 450k and RRBS: (a) Table showing the number of cytosines targeted by 850k, 450k, and RRBS through the filtering steps. Within parentheses: Percentages of the total number remaining after filtering. (b-c) Barplot of the number of cytosines covered by 850k (red), 450k (green), and RRBS (blue) according to the CGI-associated region (b) or regulatory region (c) where the cytosines are located. Top: lollipop scheme of the assessed regions. Cytosines are represented as white lollipops. (b) The scheme highlights that CGIs (dark grey) are CpG-dense regions, Shores (light grey) are regions located up to 2 kb from a CGI, and the Open sea (white) contains the remaining parts of the genome. (c) The scheme shows two example cell types. Enhancers and promoters, identified through ENCODE chromatin state segmentation, are shown, respectively, in medium grey and dark grey. A gene body (from Ensembl or LNCipedia databases) is represented in light grey. ‘Enhancer’ and ‘Promoter’ regions are defined as regions where only enhancers or promoters are identified, respectively, through use of ENCODE chromatin states across all investigated cell lines, while ‘Dual’ regions are associated with a promoter in some cell lines and with an enhancer in others. The TSS is represented as a black arrow. (d) Proportion of regulatory regions (enhancers left, promoters right) covered by at least one cytosine targeted by 850k (red), 450k (green), or RRBS (blue). Each boxplot represents the distribution of the coverage among the nine cell lines provided by ENCODE. (e) Barplot of the percentage of transcripts associated with at least one cytosine targeted by 850k (left), 450k (middle), or RRBS (right), according to the transcriptomic database (LNCipedia light grey, Ensembl dark grey).
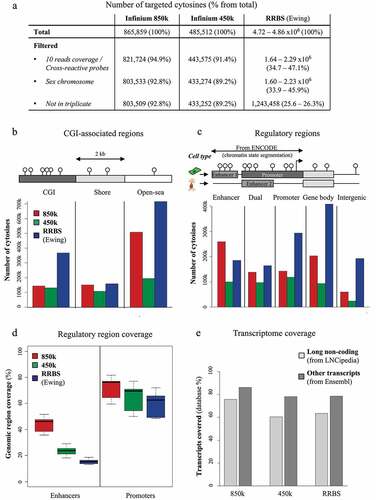
Figure 3. Evaluation of 850k-bias correction methods: (a) Boxplots showing the distribution of absolute differences between DNA methylation measurements obtained with Infinium 850k from three replicates of HCT116 WT cells (red) or between the 850k array and the 450k array (green) or between 850k and RBBS (blue), when the data are not normalized (white background), exclusively within-array normalized (orange background), or between-array normalized (possibly in a pipeline also including within-array normalization) (purple background). (b) Example of a probe impacted by the normalization method. The boxplots show the distribution of cytosine methylation levels assessed on RRBS duplicates (blue), 450k triplicates (raw measurement) (green), or 850k triplicates (raw measurement in red, normalized measurement in pink). The RRBS experiment shows a fully methylated cytosine but the raw 450k and 850k data show a beta-value lower than 1.0 . While some methods (e.g PBC, NOOB, and RCP) lead to data more similar to RRBS, others (e.g Dasen, LOESS) distort the data towards a hemi-methylated level. (c) Boxplots showing the distribution of the standard deviation obtained upon cytosine methylation level assessment with duplicate RRBS sequencing data (blue) or triplicate 850k-array (red) or 450k-array (green) measurements. The 450k and 850k data were subjected (dark-coloured) or not (light-coloured) to NOOB or PBC normalization. (d) Barplot showing levels of variance heterogeneity for HCT116 cell line methylation data: raw 450k data subjected (light green) or not (dark green) to normalization; 850k data subjected (pink) or not (dark red) to normalization. RAW: raw Infinium data; PBC: peak-based correction from the wateRmelon package; NOOB: Normal exponential convolution using out-of-bounds; RCP: regression on correlated probes method; SWAN: Subset quantile Within-Array Normalization from the minfi package; QN+BMIQ: pipeline formed by quantile normalization on intensities followed by beta-mixture quantile normalization; Tost: categorical SQN from the Touleimat and Tost pipeline; NOOB+Fun: pipeline composed of NOOB correction followed by functional normalization; Dasen: Dasen pipeline from the wateRmelon package. LOESS: local-regression between-array normalization.
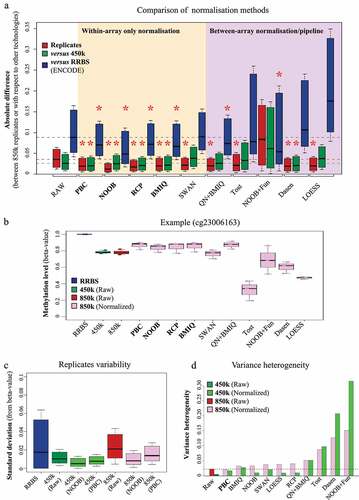
Figure 4. Differential methylation analysis of breast tumours vs normal samples with 850k: (a) Heatmap of the differentially methylated probes identified on the 850k array upon comparing breast tumour samples (samples S5 to S14, purple rectangle) with normal breast tissue samples (samples S1 to S4, grey rectangle) after PBC normalization. The methylation level is represented on a blue (unmethylated) to red (methylated) scale. Hypermethylated and hypomethylated probes are highlighted respectively a dark grey and a light grey vertical bar. (b) Pie chart of the proportion of differentially methylated promoter and non-promoter probes. Blue: promoter, red: non-promoter, light: probes common to the 850k and 450k versions, dark: probes specific to the 850k array. The part surrounded in black contains probes common to the two versions. (c) Barplot of the number of differentially methylated cytosines that can be assessed exclusively by 850k (dark) or that are common to 850k and 450k (light). The differentially methylated cytosines are associated with ‘Enhancer,’ ‘Dual,’ ‘Promoter,’ ‘Gene body,’ and ‘Intergenic’ regions according to the ENCODE-based (orange) or Illumina default annotation (blue). The ENCODE-based annotation shows a lower proportion of differentially methylated cytosines not associated with any feature (i.e., ‘Intergenic’). This leads to better interpretability of results. (d) Barplot showing the number of transcripts associated with at least one differentially methylated cytosine, according to the reference annotation (Illumina default left, ENCODE-based right) and the transcriptomic database (LNCipedia light grey, Ensembl dark grey). It highlights strong improvement in the number of transcripts identified with the ENCODE-based annotation as compared to Illumina’s default annotation.
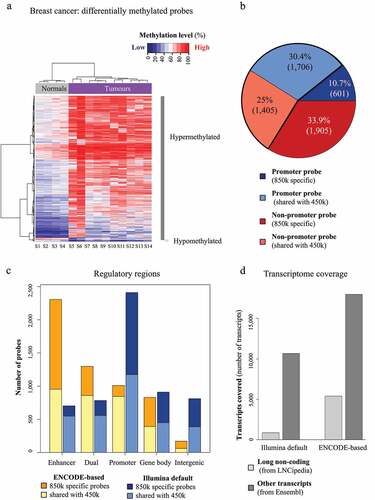
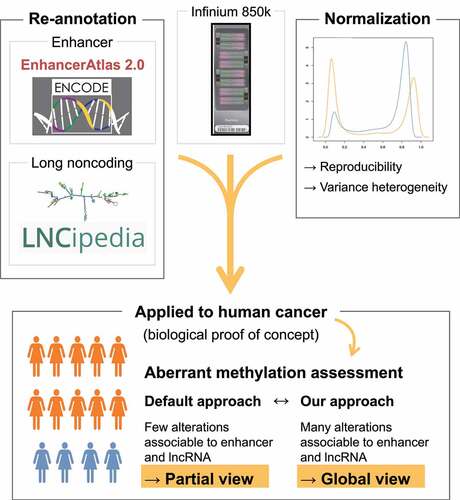
Figure 5. An updated processing approach for 850k data: Our new processing approach for 850k data, based on refined probe annotation and normalization, allows for improved analysis of DNA methylation at enhancers and long noncoding RNA genes. This approach highlights, as previously reported, aberrant enhancer methylation as a dominant feature in breast cancer. Thus, the 850k array, together with our new processing approach, allows for improved high-throughput, low-cost analysis of DNA methylation in clinical samples.