Figures & data
Figure 1. CETYGO captures variation in accuracy of cellular deconvolution in whole blood. Line graphs plotting the error associated with estimating the cellular proportions of reconstructed whole blood profiles with increasing proportion of noise (x-axis). Where the y-axis presents A) the root mean square error (RMSE) between the fixed cellular proportions used to construct the whole blood profiles and the estimated proportions generated with Houseman’s method, B) the error metric CETYGO and C) the sum of all proportions estimated. The points represent the mean value and the dashed lines the 95% confidence intervals calculated across multiple simulations. The two lines represent simulations constructed from reference data generated from two different platforms, the Illumina 450K and EPIC BeadChip microarrays.
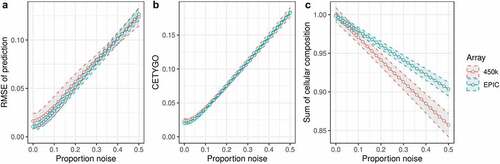
Figure 2. Cell type dependent effects on accuracy when omitted from reference based cellular deconvolution algorithms. Line graph of the error associated with estimating the cellular proportions of reconstructed whole blood profiles where the reference panel is missing one of six cell types. Each coloured line represents a different cell type being omitted from the reference panel, but included in the reconstructed whole blood profiles used for testing. Plotted is the proportion in the testing profile that the missing cell type is set to occupy (x-axis) against the error, measured using the CETYGO score, of the deconvolution (y-axis). The points represent the mean value and the dashed lines the 95% confidence intervals calculated across multiple simulations.
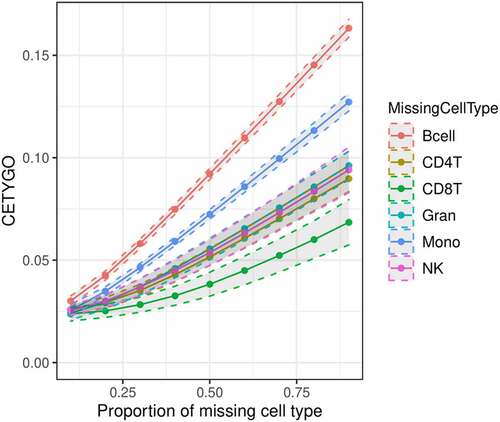
Figure 3. The accuracy of cellular heterogeneity estimation increases as the reference panel becomes more representative. Violin plots of the error associated with estimating the cellular proportions of reconstructed whole blood profiles where the reference panel is missing between one and three cell types. Each violin plot shows the distribution of the error, measured using CETYGO, of the deconvolution (y-axis) grouped by A) the number of cell types included in the reference panel and B) the proportion of cells in the reconstructed whole blood profile that are from cell types included in the reference panel.
Figure 4. The CETYGO score captures the tissue specificity of deconvolution reference panels. Violin plots of the error associated with estimating the cellular proportions where a reference panel consisting of six blood cell types was applied to 10,447 DNA methylation profiles, across 18 different datasets and 20 different sample types. Each violin plot shows the distribution of the error, measured using the CETYGO score, of the deconvolution (y-axis) grouped by the tissue/cell-type, where the violins are coloured to highlight which samples are derived from blood, which are human derived non-blood bulk tissue, and which are human derived cell-lines.
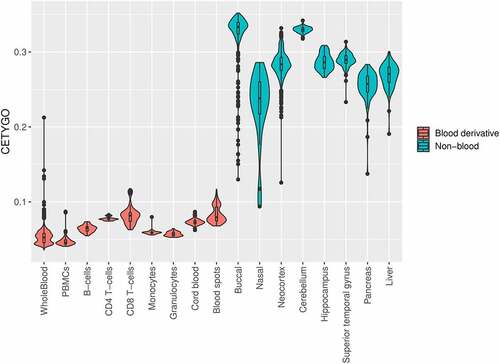
Figure 5. The CETYGO score correlates with metrics of data quality. Summaries of the error associated with estimating the cellular proportions as a function of quantitative metrics of DNA methylation array signal for 725 samples from Dataset 3. A) Violin plot of the distribution of the CETYGO score, grouped by whether the sample is of sufficient quality to pass the quality control pipeline. Scatterplots of the error, measured using the CETYGO score (y-axis) for each sample against, B) the median methylated (m) intensity across all sites on the microarray, C) the median unmethylated (u) intensity across all sites on the microarray, D) the bisulpfhite conversion % calculated as the mean across 10 fully methylated control probes. In panels, B, C and D, the points are coloured by whether the sample passed quality control in panel A or not.
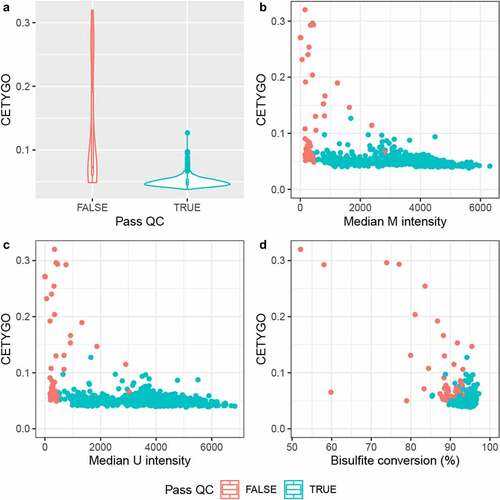
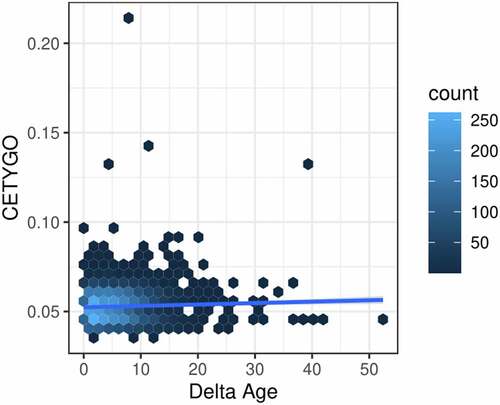
Figure 6. Error in estimation of cellular heterogeneity from DNA methylation data correlates with error from epigenetic clock algorithms. Heatscatterplot of the error measured using the CETYGO score (y-axis), associated with estimating the cellular proportions across 6,351 whole blood profiles against the difference between the sample’s chronological age and age predicted using Horvaths pan-tissue algorithm from the DNA methylation data (delta age; x-axis). The colour of the points represents the density of points at that location.