
Figures & data
Figure 1. Evolutionary analysis of Epigenetic regulators (ERs). (a) Heatmap of numbers of ER gene duplication events occurred in representative domains and species. Duplication events were inferred by OrthoFinder. (b) A phylogenetic tree of BRPF1/3 and BRD1. Blue squares represent the nodes with duplication occurrence. (c) Duplicated gene expression correlation Z-scores for duplicated gene pairs and permutated gene pairs based on the human coexpression data. (d) Gene Ontology (GO) Biological Processes (BP) semantic similarity for duplicated gene pairs and permutated gene pairs. (e) GO Molecular Function (MF) semantic similarity for duplicated gene pairs and permutated gene pairs. (f) Venn plots of the identified duplicated ER genes and functional gene sets. The percentages above the p-values are defined as the ratio of the overlapping gene number to the gene number in our duplicated gene list. P-values were calculated by Fisher’s exact test.
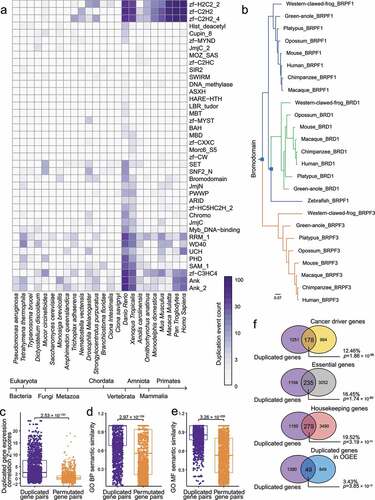
Figure 2. Consistent tissue-of-origin expression patterns of duplicated epigenetic regulator (ER) genes in human and mouse. (a) Heatmap of log(TPM) expression levels of ERs in human and mouse tissues. Testis is distinct from other tissues where many genes show highly specific expression, whereas other tissues like Heart show very little variance of ER expression. (b) Gene expression correlation analysis of the GTEx data from human and the ENCODE data from mouse. Gene expression correlation was determined by Pearson correlation based on residuals calculated by rlm function in R.
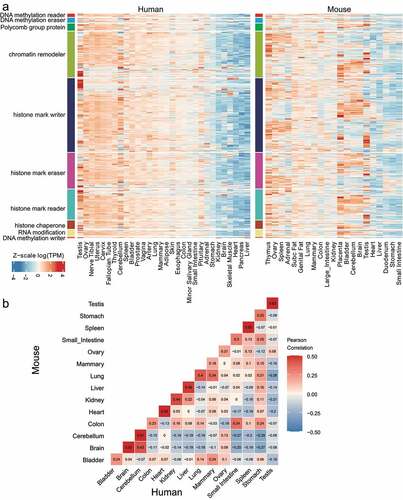
Figure 3. Analysis of tissue-specific expression for duplicated epigenetic regulator (ER) genes in human and mouse. (a) Scatter plots showing the mRNA mean abundance in testis and Heart versus all tissues for ERs genes in human. (b) Scatter plots showing the mRNA mean abundance in testis and heart versus all tissues for ERs genes in mouse. From (a)-(b), testis has more tissue-specific genes than Heart in human and mouse. Tissue-specific genes in subplots are highlighted in red. (c) Principal Component Analysis (PCA) of ER gene expression in human tissues. Gene symbols of chromatin remodeller and DNA methylation eraser outliers are shown. (d) Bar plots of the percentages of the human (c) and mouse (e) outlier ER genes of each ER type in all outlier ER genes (in PCA plots). As a comparison, the bar plots of the percentages of the ER genes of different ER types in all ER genes are also shown. Gene numbers are shown above the bars. P-values were calculated by Fisher’s exact test. (e) PCA of ER gene expression in mouse tissues. Gene symbols of chromatin remodeller and DNA methylation eraser outliers are shown. (f) PCA loading plot of human tissues based on PCA analysis in (c). (g) PCA loading plot of mouse tissues based on PCA analysis in (e). For PCA plots, only the first two principal components (PC1 and PC2) are shown. The PCA loading plots in (f) and (g) indicate the contribution of human or mouse tissues on the first two principal components (PC1 and PC2). The percentage of variance explained by each principal component is shown in the label of each axis.
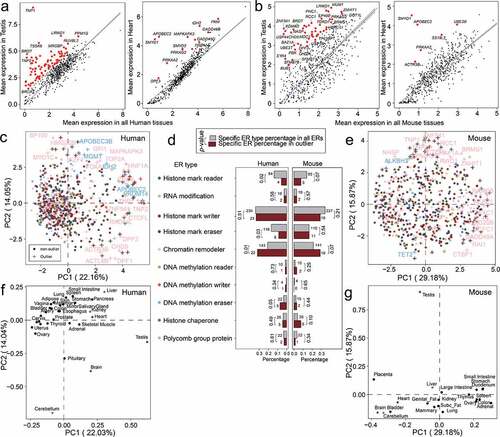
Figure 4. Analysis of tissue-specific expression for duplicated epigenetic regulators (ERs) with specific epigenetic substrates in human tissues. (a) PCA of gene expression in ERs with indicated epigenetic substrates in human GTEx tissues. (b) Heatmap of log(TPM) values of ERs with indicated epigenetic substrates throughout human GTEx tissues. Data are Z-scale processing row-wisely. Right-side rectangles represent different ER substrate types and are coloured based on the colour scheme at the bottom left in this figure.
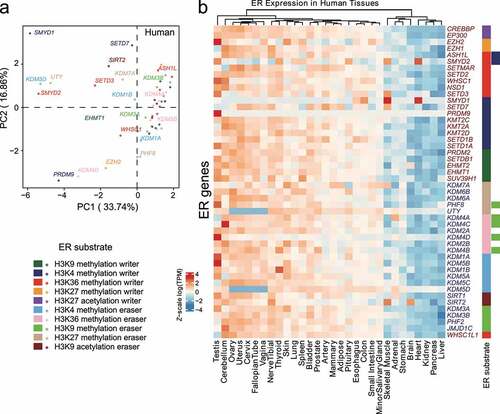
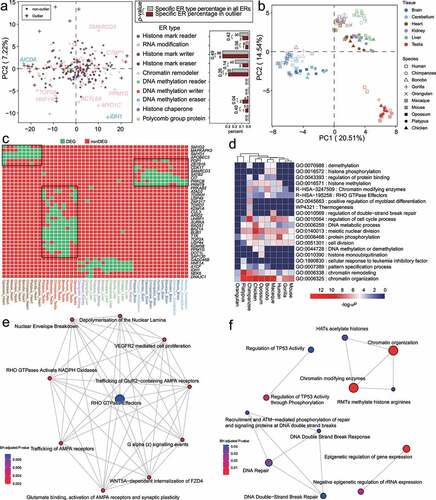
Figure 5. Analysis of Epigenetic regulator (ER) expression specificity in six tissues across ten amniote species. (a) Principal component analysis (PCA) of ER log(RPKM) expression in amniote tissues. In the PCA plot (left panel), only the first two principal components (PC1 and PC2) are shown. Gene symbols of chromatin remodeller and DNA methylation eraser outliers are shown. Right panel shows the bar plots of the percentages of the outlier ER genes of each ER type in all outlier ER genes (in PCA plots). As a comparison, the bar plots of the percentages of the ER genes of different ER types in all ER genes are also shown. Gene numbers are shown above the bars. P-values were calculated by Fisher’s exact test. (b) PCA loading plot showing that tissues in different species are well clustered. Testis and brain tissues are clearly separated from the other amniote tissues for all species. (c) Heatmap of tissue-specific genes (i.e., differentially expressed genes, DEGs) for different species. Only DEGs that are associated with at least two tissues or two species are shown due to space limitation. (d) Pathway enrichment analysis of DEGs for different tissues of species. (e) Reactome pathway over-representation analysis based on brain-specific genes. (f) Reactome pathway over-representation analysis based on testis-specific genes.
Supplemental Material
Download MS Excel (518.2 KB)Data availability statement
The data used in this study are all publicly available, see ‘Datasets’ section for further details. The generated results in this study can be found in Supplemental data.