Figures & data
Figure 1. mRNA transcriptome changes in WT and αERKO mouse SVs during normal development and after neonatal DES exposure. (a) RNA-seq DEG analysis for week 5 and week 10 mouse SVs as well as the overlap of both groups. (b) Heat maps displaying DEGs (αERKO-veh versus WT-veh) at week 5 and week 10. Heat map is plotted using z-scores. (c) Heat maps displaying DEGs (WT-DES versus WT-veh) at week 5 and week 10. (d) Persistently altered DEGs in WT-DES vs. WT-veh (overlap of week 5 and week 10 DEGs). DEGs are split into the four indicated categories. (e) Go categories analysis for week 5 DEGs (WT-DES versus WT-veh) and persistently altered DEGs. (f) Overlap of persistently altered DEGs and DEGs from Pten conditional prostate epithelial KO (prostate tumours) vs WT (normal prostate). Graph plotted of correlation of gene expression change direction from both datasets.
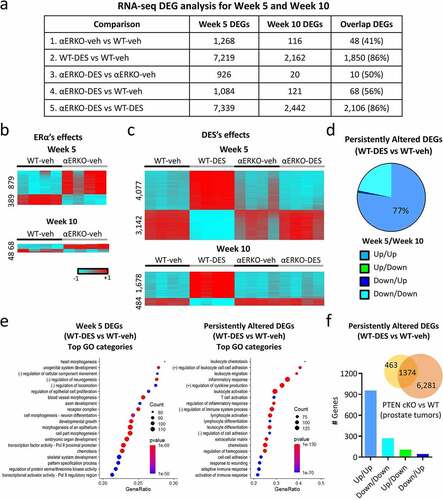
Figure 2. Expression of histone modifying enzymes and activity is altered in SVs following neonatal DES exposure. Impact of DES treatment in WT and αERKO mice on genes associated with the following types of histones modifying genes (a-d). (a) Lysine methyltransferases (Kmts). (b) Lysine demethylases (Kdms). (c) Lysine acetyltransferases (Kats). (d) Lysine deacetylases (Hdacs). Heat maps of gene expression (log2 normalized FPKM) were plotted for each indicated category at week 5 and week 10. (e) Real time RT-PCR of Ezh2 in SV at 10 weeks in WT-veh, WT-DES, αERKO-veh and αERKO-DES (n = 4 per group). Numbers shown are Ezh2 expression normalized to 18S and then fold change calculated using the average of the WT-veh group set to 1. *p-value<0.01 using Mann Whitney. (f) ELISA assay analysis on H3K9ac. (g) Histone H3K27me3, H3K27ac and total H3 immunoblots for each indicated category at week 10 (n = 3 individual mice per group). H3K27me3 and H3K27ac were normalized to total H3, and values plotted in graphs.
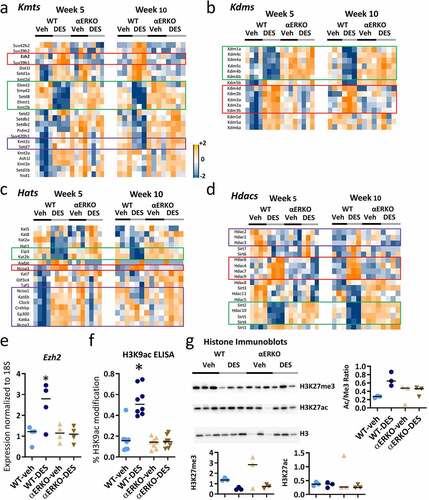
Figure 3. Histone H3K27ac changes in WT and αERKO mouse SVs during normal development and after DES exposure. (a) H3K27ac ChIP-seq DHRs (gain and loss) analysis in SVs at week 5 and week 10 as well as the overlap of these two time points. The comparison being made is indicated on each row of the table. (b) Heat maps displaying DHRs separated by gain and loss (WT-DES versus WT-veh) during SV development and following neonatal DES exposure in WT mice (left). UCSC browser tracks displaying example regions with DHRs (right). Black arrows denote region that is different due to treatment or genotype. Chromosome locations are indicated above each track. (c) Heat maps displaying DHRs separated by gain and loss (WT-DES versus WT-veh and ERKO-DES versus αERKO-veh) in WT and αERKO adult SVs following neonatal exposure to DES exposure (left). UCSC browser tracks displaying example regions with DHRs (right). Black arrows denote region that is different due to treatment or genotype. Chromosome locations are indicated above each track.
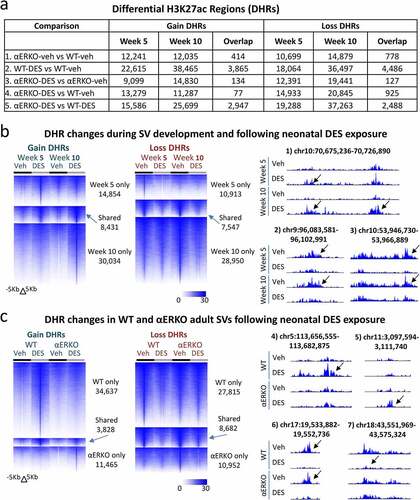
Figure 4. Correlation between DEGs, DHRs and DMRs in SV following neonatal DES exposure. (a) Percent of up- and down-regulated genes (WT-DES versus WT-veh) at week 5 and week 10 that have a DHR gain or loss ±100 Kb of the TSS. (b) Heat map displaying 1,850 persistently altered DEGs (WT-DES versus WT-veh, overlapping week 5 and week 10). RNA-seq (log2 FPKM) and H3K27ac ChIP-seq signal mapping to a ± 5 kb window around TSS in WT and αERKO SVs. Heat maps are split into up- and down-regulated genes. Heat maps are organized by high to low expression in the WT-DES RNA-seq sample and H3K27ac signal is plotted in the same gene order. (c) DHRs ±100 Kb of the TSS of up- or down-regulated genes are plotted. Heat map is organized by high to low signal in the WT-DES sample. (d) Percent overlap of DHR (gain or loss) and DEG (up or down) is plotted. Black arrows indicated the expected correlation of DHR and DEG direction. (e) Percent overlap of DMR (gain or loss) and DEG (up or down) is plotted. (f) Overlap of DEG/DHR categories from Figure 4d with DMRs are plotted in a stacked bar chart with open part of the bar as percentage of DMR gain and solid part of the bar as DMR loss. Pie chart indicated the proportion of expected and unexpected DMR direction. (g) Examples of the RNA-seq and H3K27ac at the TSS and enhancers of persistently altered genes.
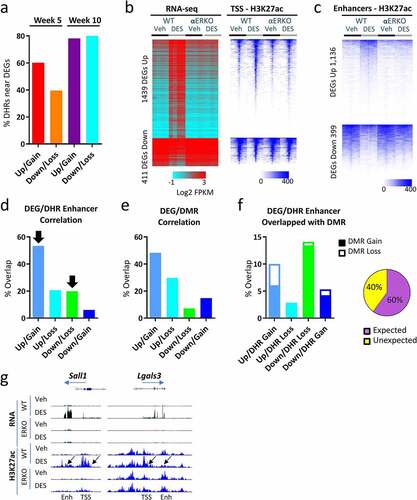
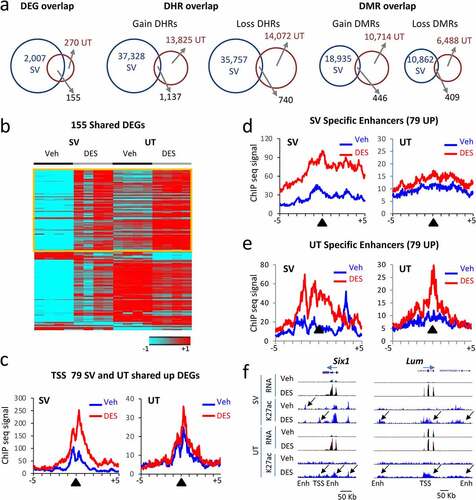
Figure 5. Correlation between mRNA DEGs and H3K27ac DHRs in adult mouse SV and uterus (UT) tissues following neonatal DES exposure. (a) Overlap of DEGs, DHRs, and DMRs between SV and UT at 10 weeks. (b) Heat map displaying 155 DEGs in common between SV and UT at 10 weeks (WT-DES versus WT-veh). Signal plotted is RNA-seq (log2 FPKM) and heat maps are organized by high to low expression in the WT-DES SV sample (c) Metaplots of H3K27ac ChIP-seq signal mapping to a ± 5 kb window around TSS of 79 upregulated genes in WT-veh and WT-DES SV and UT (d) Metaplot of SV specific enhancers, DHRs ±100 Kb of the 79 upregulated genes in SV sample. (e) Metaplot of UT specific enhancers, DHRs ±100 Kb of the 79 upregulated genes in UT sample. (f) UCSC genome browser tracks of example DEGs with DHRs (Six1 and Lum; transcription direction indicated by a blue arrow). TSS and enhancer (Enh) are indicated below the tracks. Sample is indicated on the left and black arrows indicate differential regions of H3K27ac ChIP-seq signal.