
Figures & data
Figure 1. Plot of the estimated density of DNA methylation levels. The DNA methylation levels of 123,851 CpG sites was analysed from fresh and fresh-frozen epidermis of six mice with WGBS (top) and BeadChip (bottom).
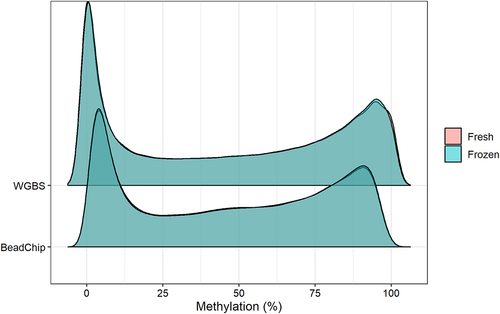
Table 1. Summary of DNA methylation levels (%) of 123,851 CpG sites obtained with the BeadChip and WGBS from fresh and fresh-frozen epidermis of six mice.
Figure 2. Mean DNA methylation levels of 123,851 CpG sites between fresh and fresh-frozen epidermis of six mice analysed with (a) BeadChip and (b) WGBS.
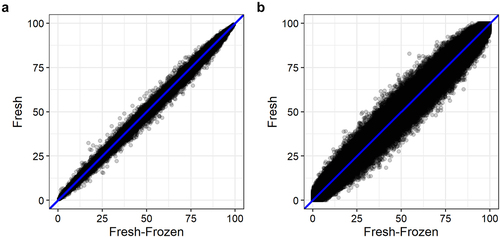
Figure 3. DNA methylation levels of 123,851 CpG sites analysed with BeadChip and WGBS. a: Mean methylation levels of 123,851 CpG sites across 12 samples analysed with BeadChip and WGBS. b: PCA plot of methylation levels of 12 samples analysed with BeadChip and WGBS.
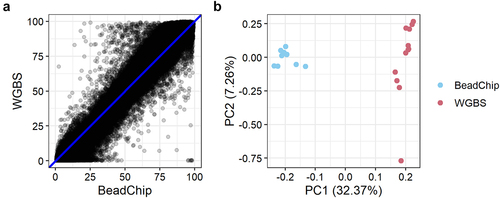
Figure 4. Delta values (methylation level obtained with BeadChip minus methylation level obtained with WGBS) for each sample grouped in ten WGBS methylation intervals.
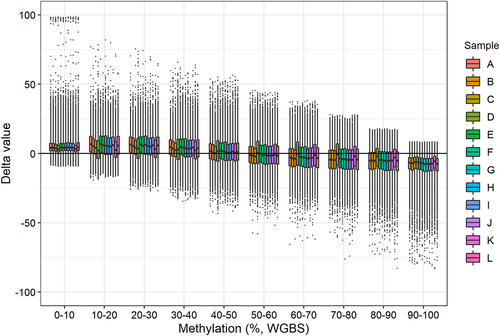
Figure 5. Delta values of DNA methylation levels per WGBS methylation interval stratified by WGBS coverage. a: Delta values (methylation level obtained with BeadChip minus methylation level obtained with WGBS) of 123,851 CpG sites per WGBS methylation interval divided into four WGBS coverage bins: 15–25, 26–35, 36–45, and ≥ 46 reads. b: Delta values (methylation value obtained with BeadChip minus methylation value obtained with WGBS) of 242,219 CpG sites per WGBS methylation interval divided into seven WGBS coverage bins: 1–5, 6–10, 11–15, 16–25, 26–35, 36–45, and ≥ 46 reads.
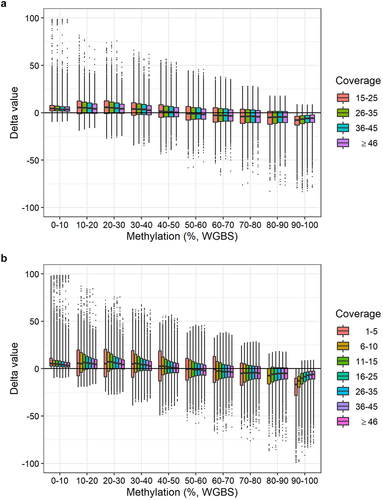
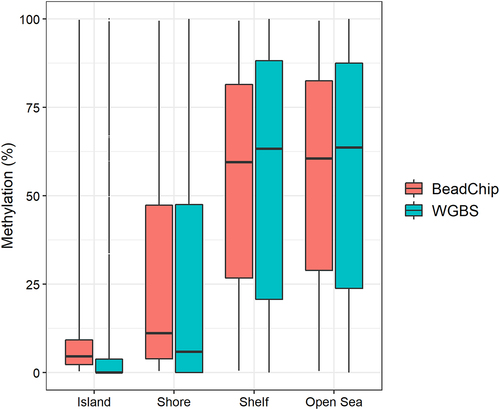
Figure 6. DNA methylation levels of 123,851 CpG sites based on the CpG site location in either CpG Islands (Island), CpG island shores (Shore), CpG island shelves (Shelf), or other genomic locations (Open Sea) analysed with BeadChip and WGBS.
Supplemental Material
Download Zip (408.2 KB)Data availability statement
The data supporting the findings of this study have been deposited in NCBI’s Gene Expression Omnibus (GEO) and are accessible through GEO series accession number GSE213749.