
Figures & data
Figure 1. Transcript expression of SPRY4 in colorectal cancer (CRC) patients. (a) Increased SPRY4 transcripts in adenocarcinomas compared to healthy mucosa from Gene Expression Omnibus (GEO) dataset (GSE166427). Increased SPRY4 transcripts in adenocarcinomas compared to adjacent control from (b) GEO dataset (GSE166427) and (c) The Cancer Genome Atlas (TCGA). (d) Increased SPRY4 transcripts in microsatellite instable (MSI) CRC patients compared to adjacent control. (e) No statistical difference in transcript expression (FPKM) was observed between SPRY4-diploid CRC patients (0) and CRC patients with copy number gains of SPRY4 (1).
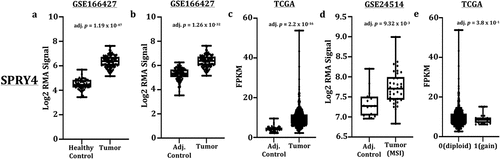
Figure 2. SPRY4 proximal promoter methylation in colorectal cancer (CRC) patients. SPRY4 promoter methylation β-value comparison of eight probes spanning the 5'UTR/1st Exon to a small CpG island (~1500 bps from TSS) between CRC patients archived in The Cancer Genome Atlas (TCGA) and their corresponding adjacent control samples. No statistical significance between groups was observed. Note: DNMIVD is a database in which boxplot data results from methylation queries on the SPRY2 gene promoter were automatically generated.
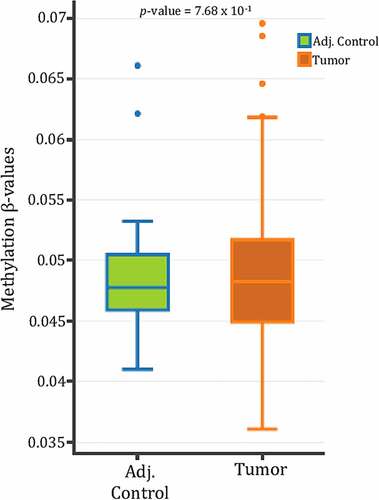
Figure 3. DNA methylation 450K probe data in SPRY4 in colorectal cancer patients archived in The Cancer Genome Atlas. Three statistically differentially methylated CpG probes between adjacent control colon and colon adenocarcinomas located in the [distal promoter regions: CG08951638 & CG02713162] and the [gene body: CG27041304] of SPRY4 (shown left to right). Note: A decrease in mean methylation β-values in both distal promoter regions of SPRY4 and an increase in methylation β-values in the gene body of SPRY4 in colon adenocarcinomas.
![Figure 3. DNA methylation 450K probe data in SPRY4 in colorectal cancer patients archived in The Cancer Genome Atlas. Three statistically differentially methylated CpG probes between adjacent control colon and colon adenocarcinomas located in the [distal promoter regions: CG08951638 & CG02713162] and the [gene body: CG27041304] of SPRY4 (shown left to right). Note: A decrease in mean methylation β-values in both distal promoter regions of SPRY4 and an increase in methylation β-values in the gene body of SPRY4 in colon adenocarcinomas.](/cms/asset/72eef350-8b0e-4112-8895-25b4d672d9c0/kepi_a_2145068_f0003_b.gif)
Figure 4. Determining DNA methylation and hydroxymethylation levels of SPRY4 in colorectal cancer (CRC) patients. (a) Combined bisulfite restriction assay (COBRA) results of three regions of interest located in the promoter region of SPRY4 from 13 CRC patients (T# patient ID number) and adjacent normal colonocytes (C# patient ID number). Each sample was run on two lanes: lane (1) bisulfite-treated PCR-amplified DNA without restriction enzyme digestion, which served as a reference control for unmethylated CpG and lane, and (2) bisulfite-treated PCR-amplified DNA digested with a restriction enzyme recognizing amplicons containing a 5'mCpG sequence. + Lane: PCR product treated with restriction enzyme lane, – Lane: PCR product from untreated sample. Yellow arrows serve to highlight differential methylation between matched control and tumor samples for a given patient. For instance, in region #1, the PCR band product (top band) in experimental lane 40 (#542 patient tumor) was less enzymatically digested and therefore higher in intensity (less methylated) than the top PCR band in lane 38 (#542 patient control). Again, in region #2 of patient #542, enzymatic digestion of PCR products was less evident in the tumor sample vs. the control sample, indicating hypomethylation (loss of methylation) in regions #1 and #2 in CRC patient #542. (b) 5-hydroxymethylcytosine (5hmC) abundance in SPRY4 gene bodies in colon cancers and matched adjacent mucosa (n = 12 samples, p < 0.05, paired Student’s t-test): No change in mean log2 fold change values of 5hmC in the SPRY4 gene promoter and a statistically significant decrease in gene body 5hmC in colon tumors (Tumor) compared to normal colon (Control).
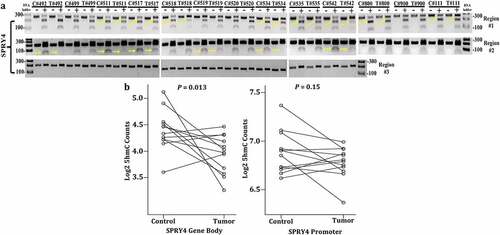
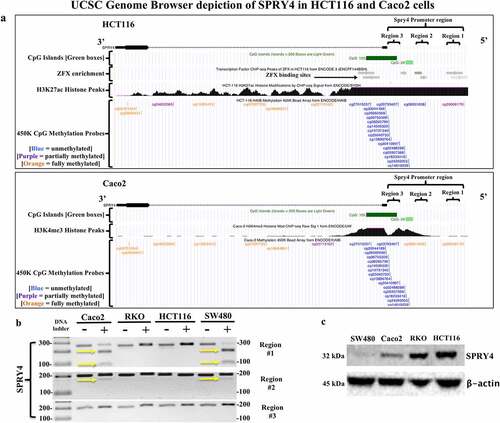
Figure 5. Evaluating SPRY4 promoter methylation and protein expression in colorectal cancer (CRC) cells. (a) UCSC Genome Browser (hg19 build) depiction of SPRY4 in two CRC cell lines: (top) HCT116 and (bottom) Caco2. SPRY4 contains two CpG islands (green), and according to ChIP-seq data, in HCT116 cells, there are ZFX transcription factor (TF)-binding sites located in region #1 and #2 (grey bars = TF-binding enrichment). Note the extensive methylation that is present in regions #1 and #2 of SPRY4 in Caco2 cells as indicated by two orange (full methylation) vertical tick marks. In contrast, HCT116 cells contain probable partial methylation spanning the distal end of region #1 but no methylation in region #2, as indicated by a blue (no-methylation) vertical tick mark. Lastly, ChIP-seq peaks associated with active transcriptional regulatory regions of SPRY4 are represented by histone markers (H3K27ac) and (H3K4me3) in CRC cell lines HCT116 and Caco2, respectively. (b) COBRA results of three regions of interest located in SPRY4 from: four CRC cell lines: Caco2, RKO, HCT116, and SW480 cells. The yellow arrows indicate the presence of 5mC: region #1 shows partial PCR product enzymatic digestion in Caco2 and SW480 cells and region #2 displays slight PCR product enzymatic digestion, indicating partial methylation of SPRY4 in Caco2 and SW480 cells in both regions. Region #3 shows no evidence of methylation in all CRC cell lines. (c) Western blot analysis of SPRY4 protein expression in four CRC cell lines that inversely correlate with 5mC status in regions #1 and #2.
Supplemental Material
Download Zip (574.3 KB)Data Availability Statement
Patient data were extracted from The Cancer Genome Atlas data repository: COAD (Colon adenocarcinomas) and GEO (Gene Expression Omnibus). https://www.cancer.gov/about-nci/organization/ccg/research/structural-genomics/tcga&https://www.ncbi.nlm.nih.gov/geo/