
Figures & data
Figure 1. CONSORT diagram of study participants. Participants included in the epigenetic 2-year follow-up analysis are shown.
Table 1. Demographics and medical characteristics of participants included in the 2-year epigenetic follow-up analysis.
Figure 2. Locations of Differentially Methylated Positions and Regions. Bar chart depicting the distribution of DMPs (a), DMRs (b) and CpG sites within DMRs (c) over the gene regions. The blue and red area represent the proportion that is hypomethylated and hypermethylated respectively in the children who had been admitted to the PICU 2 y prior to the follow-up study compared to the healthy control children. For our calculations, we defined the promoter as 0 to 1500 base pairs upstream of the transcription start site and the first exon is reported separately and thus is not included into the gene body. Note: Abbreviations: DMP, differentially methylated position; DMR, differentially methylated region; PICU, Paediatric Intensive Care Unit, UTR: untranslated region
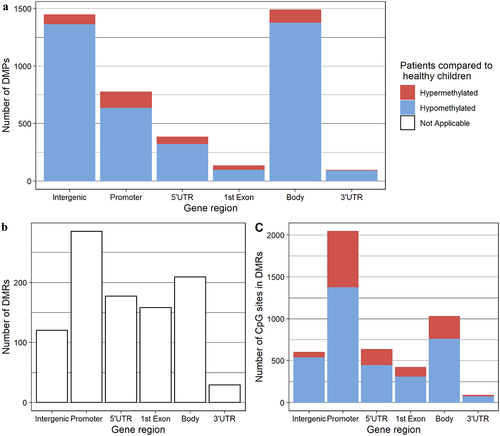
Table 2. Summary of absolute differences in methylation between former PICU patients and healthy children.
Table 3. Twenty-five most differentially methylated pathways in former patients 2 y after PICU-admission versus healthy children.
Supplemental Material
Download Zip (1.4 MB)Data availability statement
Data sharing is offered under the format of collaborative projects. Proposals can be directed to the corresponding author.