Figures & data
Figure 1. Decreased circ_0078607 abundance in OC tissues and DDP-resistant cells. (a) qPCR analysis of circ_0078607 level in OC clinical samples. (b) Kaplan-Meier survival plot of OC patients with high or low circ_0078607 level. (c) The cell viability at different concentrations of DDP treatment was detected by CCK-8. (d) qPCR analysis of circ_0078607 expressions in various cells. (e) Cells were exposed to actinomycin D for various time intervals, then circ_0078607 and SLC22A3 levels were assessed by qPCR. (f) The circ_0078607 and SLC22A3 levels in response to RNase R treatment were detected by qPCR. (g) qPCR for the nuclear and cytoplasmic expression of circ_0078607. **, P < 0.01; ***, P < 0.001.
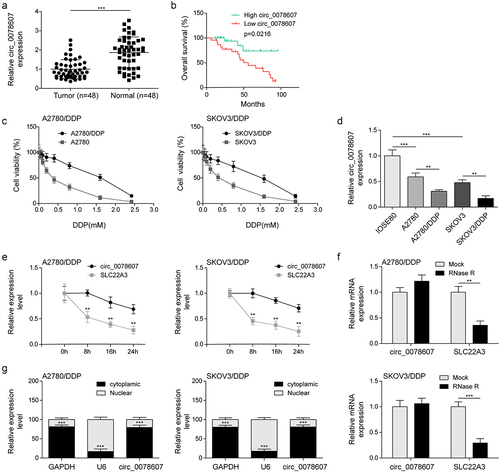
Table 1. The clinicopathological parameters of patients with ovarian cancer.
Figure 2. Circ_0078607 directly bond to miR-196b-5p. (a) The binding sites between circ_0078607 and miR-196b-5p. (b) qPCR for miR-196b-5p level in OC samples. (c) Pearson correlation analysis of circ_0078607 and miR-196b-5p expression. (d) qPCR for miR-196b-5p level in different cells. RIP assay (e) and dual-luciferase reporter assay (f) for the interaction between circ_0078607 and miR-196b-5p. **, P < 0.01; ***, P < 0.001.
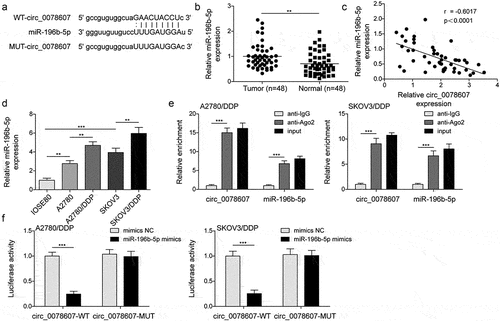
Figure 3. Circ_0078607 raised DDP sensitivity by sponging miR-196b-5p. (a) qPCR for circ_0078607 and miR-196b-5p expression after transfection with circ_0078607 overexpression plasmid. (b) MiR-196b-5p expression was determined by qPCR. (c) The cell viability at different concentrations of DDP treatment was detected by CCK-8. The proliferation was assessed by CCK-8 (d) and colony formation assay (e). (f) Flow cytometry for evaluating the apoptosis of cells. (g) Western blotting assay for determining ABCB1, CyclinD1 and Bcl-2 levels in A2780/DDP and SKOV3/DDP cells. *, P < 0.05; **, P < 0.01; ***, P < 0.001.
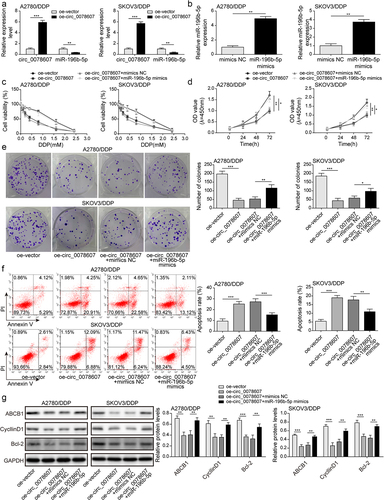
Figure 4. GAS7 was a down-stream target of miR-196b-5p. (a) The binding sites of miR-196b-5p in the 3’-UTR of GAS7. (b) qPCR for GAS7 mRNA expression in OC specimens. Pearson correlation analysis for evaluating the correlation between miR-196b-5p (c) circ_0078607 (d) and GAS7. (e) GAS7 mRNA expression in multiple cells was detected by qPCR. (f) qPCR for GAS7 abundance in circ_0078607-overexpressed cells. (g) GAS7 expression after transfection with miR-196b-5p mimics was assessed by qPCR. (h) The interaction between GAS7 and miR-196b-5p was determined by dual-luciferase reporter assay. *, P < 0.05; **, P < 0.01; ***, P < 0.001.
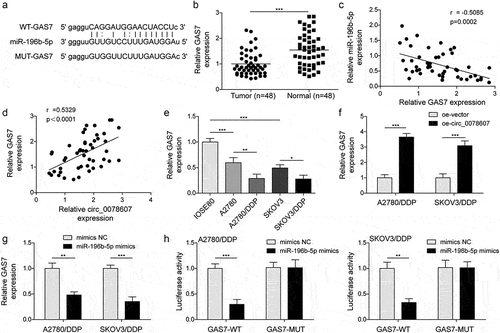
Figure 5. MiR-196b-5p conferred DDP resistance by targeting GAS7. (a) qPCR for GAS7 mRNA level after transfection with GAS7 overexpression plasmid. (b) Western blotting for evaluating GAS7 protein level in cells. (c) CCK-8 assay for determining cell viability at different concentrations of DDP treatment. (d) CCK-8 and (e) colony formation assays were used to detect the proliferation of cells. (f) Apoptosis was assessed by flow cytometry. (g) The protein levels of ABCB1, CyclinD1 and Bcl-2 were assessed by western blotting. *, P < 0.05; **, P < 0.01; ***, P < 0.001.
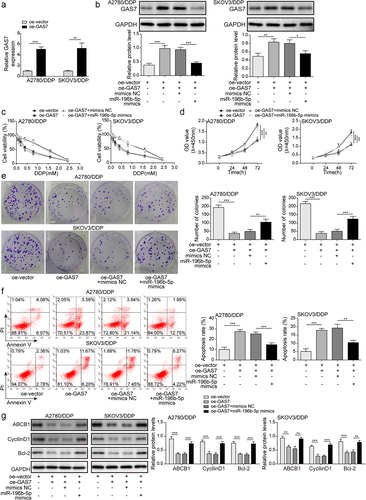
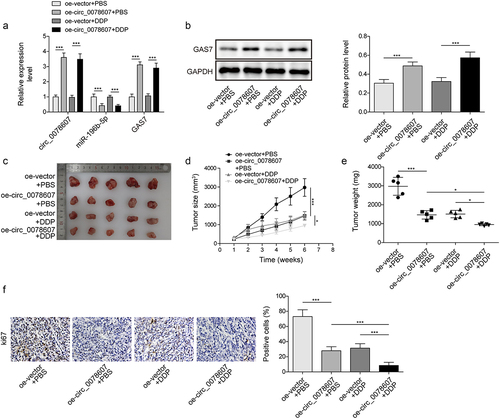
Figure 6. Circ_0078607 improved DDP sensitivity in vivo. (a) qPCR detected circ_0078607, miR-196b-5p, and GAS7 levels in tumour tissue. (b) Western blotting for evaluating the GAS7 protein level in tumour tissue. (c) The xenograft tumours of mice from different groups were shown. The growth curve (d) and weight (e) of subcutaneous xenograft tumours. (f) Immunohistochemistry staining for measuring Ki67 expression in xenograft tumours (200×). *, P < 0.05; ***, P < 0.001.