
Figures & data
Table 1. A summary of key information from participating cohorts.
Figure 1. Manhattan and volcano plots of the inverse-variance fixed meta-analysis results for gestational age and placental CpG methylation among EARLI, ELGAN, healthy start, and NHBCS.
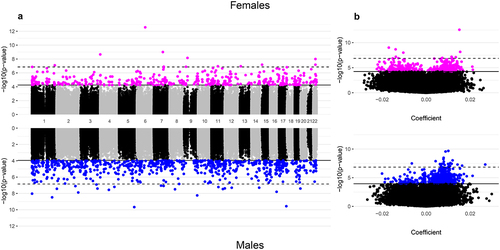
Figure 2. Overlap of FDR-significant CpGs across the meta-analyses of gestational age and placental methylation among females and males from EARLI, ELGAN, healthy start, and NHBCS, with and without cell-type adjustment.
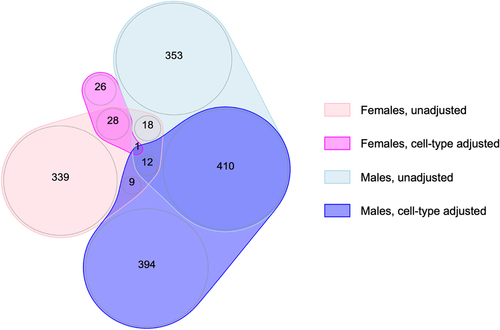
Table 2. A summary of the number of identified CpG sites from each EWAS meta-analysis of gestational age.
Table 3. Top 10 FDR-significant CpGs for the meta-analysis of gestational age and placental methylation among females and males from the EARLI, ELGAN, Healthy Start, and NHBCS cohorts.
Figure 3. Comparison of meta-analysis model coefficients for gestational age and placental CpG methylation among EARLI, ELGAN, Healthy Start, and NHBCS before and after cell-type adjustment.
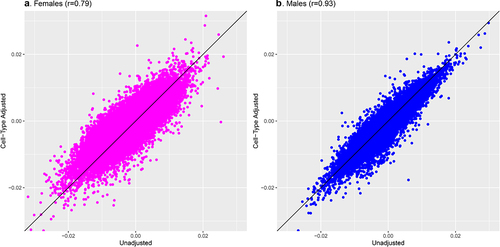
Figure 4. Manhattan and volcano plots of the inverse-variance fixed meta-analysis results for gestational age and placental CpG methylation after cell-type adjustment among EARLI, ELGAN, healthy start, and NHBCS.
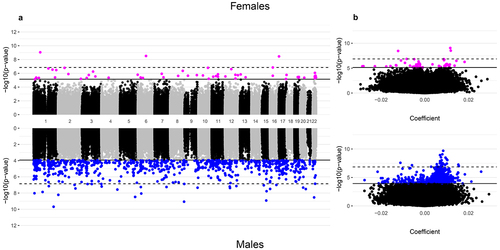
Table 4. Top 10 FDR-significant CpGs for the meta-analysis of gestational age and placental methylation with adjustment for cell-type proportions among females and males from the EARLI, ELGAN, healthy start, and NHBCS cohorts.
Figure 5. Sexually monomorphic associations of gestational age with placental methylation levels at cg17284609 (SOX6) before and after cell-type adjustment.
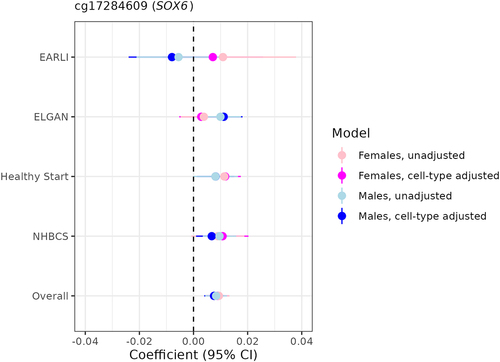
Figure 6. Sex-heterogeneous associations of gestational age with placental CpG methylation after cell-type adjustment.
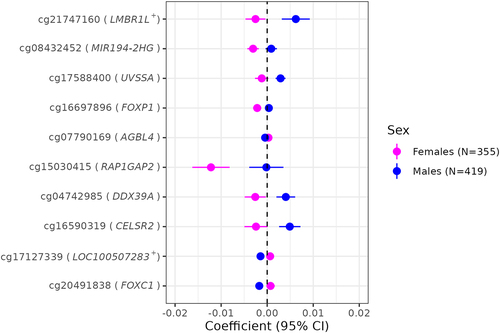
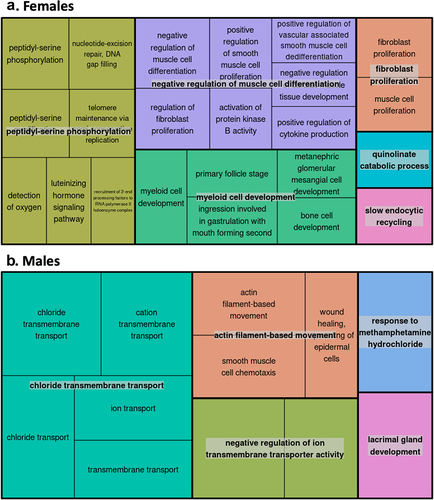
Figure 7. Gene Ontology (GO) enrichment analyses for the cell-type adjusted association of gestational age with placental CpG methylation among females and males.
Supplemental Material
Download Zip (3.1 MB)Data availability statement
The individual-level datasets used for conducting EWASs in this manuscript are not publicly available because, per the NIH-approved ECHO Data Sharing Policy, ECHO-wide data have not yet been made available to the public for review/analysis. Requests to access the individual-level datasets should be directed to the ECHO Data Analysis Center, [email protected]. However, the EWAS summary statistics from each cohort that were used to conduct subsequent meta-analyses are available through the UNC Dataverse at https://doi.org/10.15139/S3/K73DN9.
All software and programs used to conduct these analyses are freely available and are cited in the manuscript. All code used to generate our results is available on the UNC Dataverse at https://doi.org/10.15139/S3/EEB75X.