
Figures & data
Table 1. Clinicopathological data of the 113 AA prostate tissues. Number and percentage (in parentheses) of all cancer cases are shown. The age range and mean age, median, standard error (Std. Err), standard deviation (Std. dev) as well as the 95% confidence interval for mean are shown. Independent samples t-test shows that means of age are not significantly different for Grade groups 1, 2 and 3. Independent samples median test reveals that the medians of age are not significantly different for Gleason grade 4 and 5 (Fisher Exact test, case sizes are too small for Group 4 and 5 to make comparison with Group 1–3).
Figure 1. Genomic distribution of 5623 top differentially methylated CpG probes in prostate cancer compared to normal prostate tissues is expressed as percentage landscape distribution in a pie chart. a. Analysis in HUBCM dataset. b. Analysis in TCGA dataset. The methylation levels of CpG probes are shown by functional locations including TSS1500, TSS200, 5ʹUTR, 1st Exon, Body, and 3ʹUTR and intergenic (INT) regions.
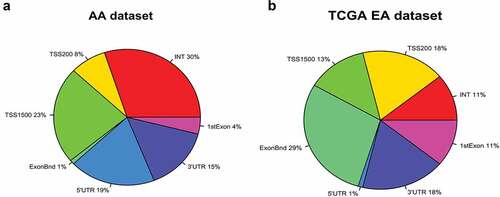
Table 2. GO term search results showing the functional categories for the genes associated with differential methylation and expression. A. Genes with high methylation and low expression and B. Genes with low methylation and high expression. For each result set, there is GO functional category, name of enrichment term, number of genes counted in term, then the number of counts in total population and the biological genes involved as well as the degree of statistical enrichment.
Figure 2. Heat map generated from hierarchical clustering analysis of the top 1263 CGI probes most variable CpG islands across all samples in the genome-wide methylation analysis and correlated with RNA expression profiles. A. The AA dataset consists of 63 PCa and 50 normal adjacent (adj.) prostate tissue DNA used in the methylation analysis and 96 RNA samples (matched PCa and normal adj. tissues) used in the transcription analysis. B. The TCGA methylation dataset consists of 504 prostate tissues used in the genome-wide DNA methylation analysis. This is made up of 58 AA PCa and 3 AA normal prostate tissues, and 412 EUR PCa and 31 EUR normal prostate tissues. The TCGA RNA expression consists of 521 prostate tissue RNA samples. This is made up of from 58 AA PCa and 7 AA normal prostate tissues, and 412 EUR PCa and 44 EUR normal tissues.
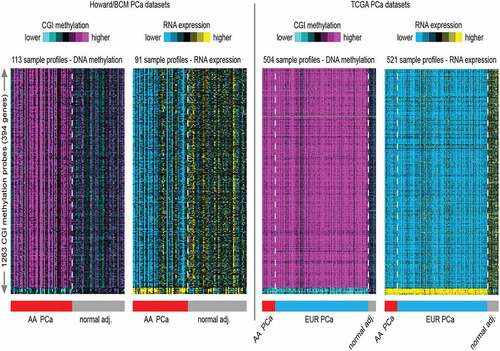
Figure 3. Hierarchical clustering analysis of 1655 CGI probes across all AA prostate tissue samples categorized by Gleason score 7–10 (grade 2–5) tumours, Gleason score 5–6 (grade 1) tumours and normal (benign) prostate tissues. a. Clustering analysis of the top 1655 CGI differential methylation that are significant (p < 0.05) by t-test and methylation change greater than 5%) and separated into Gleason 7–10; Gleason 5–6; and benign prostate tissues. b. Comparison of the significant differential DNA methylation and mRNA expression as categorized by Gleason score and normal tissues.
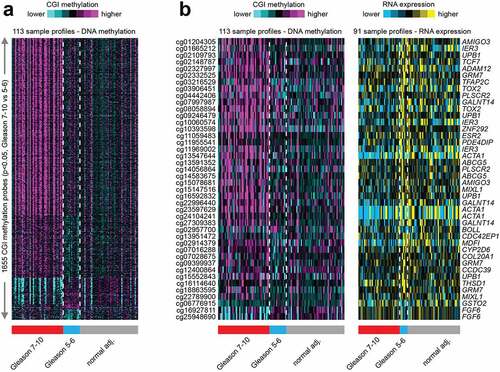
Figure 4. Predicted gene regulatory network of the overlapping genes associated with increasing Gleason score in AA prostate cancer. Ingenuity Pathway Analysis software was used to predict putative sub-networks containing five candidate genes: IER3, TFAP2C, ESR2, MIXL1, AMIGO3 (RNF123) that play a role in several mechanisms associated steroid signalling and tumour microenvironment in prostate cancer disease progression. MIXLI, TFAP2C, IER3 and ESR2 are highlighted in red.
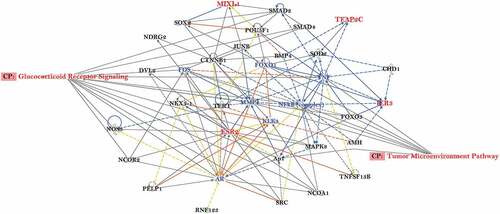
Table 3. Statistical analysis of differential methylated probes and associated gene symbol for PCa in the Howard/BCM (HUBCM) datasets and the TCGA (EUR and AA) datasets. Highlight in pink show direct correlation of differential methylation in high versus low Gleason grade PCa. Highlights in green shows inverse correlation of differential methylation in high versus low grade PCa. P-values for all probes are shown.
Data availability statement
Any data that support the finding of this study are available from the corresponding author, BKA upon reasonable non-commercial request.