Figures & data
Table 1. Primer sequences for MeRIP-qPCR.
Figure 1. m6A modification is abundant in neuronal mRNAs. (a). Pipeline used to detect m6A mRNAs in neurons. (b). Number of m6A mRNAs in each group. (c). Numbers of OGD/R-specific and common m6A mRNAs. (d). MeRIP qRT-PCR validation of the identified m6A mRNAs. (e). Visualization of the m6A mRNAs selected in Figure E. (f). RRACH conserved sequence motif for the m6A peak regions. *p < 0.05, **p < 0.01, ***p < 0.001.
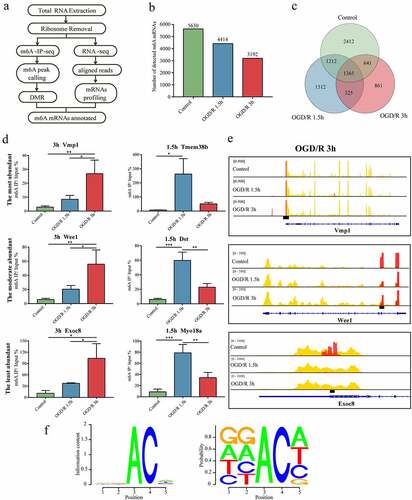
Figure 2. The m6A level does not affect the expression of m6A mRNAs. (a). Comparison of the m6A levels in the mRNAs of different groups. (b). Density distribution of the m6A levels in mRNAs. (c). Linear correlations of the m6A levels among the m6A mRNAs identified in both the OGD/R 1.5 h and OGD/R 3 h groups. (d). Relationships between the expression of mRNAs and the m6A levels in the mRNAs of the control, OGD/R 1.5 h and OGD/R 3 h groups. (e). qRT-PCR showing the expression of the top 5 least abundant-m6A mRNAs after overexpressing Mettl3. (f). qRT-PCR showing the expression of the top 5 most abundant-m6A mRNAs after overexpressing Fto (Hoxd4 could not be detected). *p < 0.05, **p < 0.01, ***p < 0.001, ns: not significant.
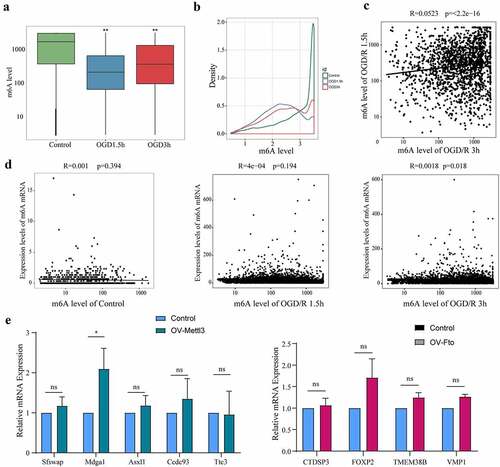
Table 2. Primer sequences for normal qRT-PCR (mRNA).
Figure 3. m6A modification is enriched in neuronal circRNAs. (a). Pipeline used to detect m6A circRNAs in neurons. (b). Genomic distributions of total circRNAs, m6A circRNAs and non-m6A circRNAs; the proportions are shown at the top. (c). Numbers of m6A circRNAs and non-m6A circRNAs derived from the different numbers of exons in each group. The number of exons (up to 12) is shown at x axis. (d). Exon lengths of total circRNAs, m6A circRNAs and non-m6A circRNAs. The lengths were calculated based on the numbers of exons spanned by the circRNAs. (e). Comparison of the exon lengths of all m6A circRNAs and non-m6A circRNAs. (f). Expression levels of total circRNAs, m6A circRNAs and non-m6A circRNAs based on the number of exons spanned by each circRNA.
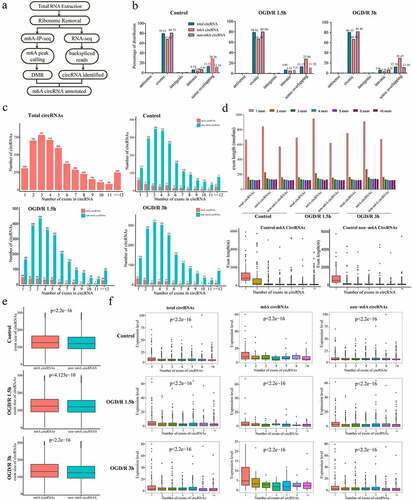
Figure 4. The m6A level does not affect the expression of m6A circRNAs. (a). Comparison of the m6A levels in the circRNAs in different groups. (b). Density distribution of the m6A levels in circRNAs. (c). Linear correlations of the m6A levels among the m6A circRNAs identified in both the OGD/R 1.5 h and OGD/R 3 h groups. (d). Relationship between the expression of circRNAs and the m6A levels in the circRNAs of the control, OGD/R 1.5 h and OGD/R 3 h groups. (e). qRT-PCR showing the expression of the top 5 least abundant-m6A circRNAs after overexpressing Mettl3 (chr16:94403314-94468060+ could not be detected). (f). qRT-PCR showing the expression of the top 5 most abundant-m6A circRNAs after overexpressing Fto (chr11:5329879-5338763- could not be detected). *p < 0.05, **p < 0.01, ***p < 0.001, ns: not significant.
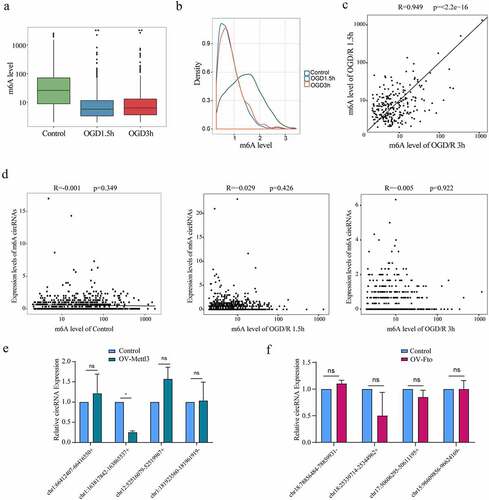
Table 3. Primer sequences for normal qRT-PCR (circRNA).
Figure 5. Crosstalk between m6A mRNAs and m6A circRNAs. (a). Venn diagram showing the overlapping genes encoding m6A circRNAs and m6A mRNAs. The total number and percentage for each part are shown. (b). m6A modifications in mRNAs and circRNAs. In the first pattern, m6A circRNAs were produced from exons with m6A modifications, and m6A mRNAs were produced from the same exons (a). In the second pattern, m6A circRNAs were produced from exons differing from those encoding m6A mRNAs (b). In the third pattern, m6A circRNAs were produced from exons that did not produce m6A mRNAs (c). (C). Distributions of exons encoding circRNAs and m6A circRNAs across genes compared with the m6A peak distributions on linear RNAs. (d). MeRIP qRT-PCR validation of the identified genes containing m6A peaks that could generate m6A mRNAs and m6A circRNAs. (e). Visualization of genes containing m6A peaks that could generate m6A mRNAs and m6A circRNAs.
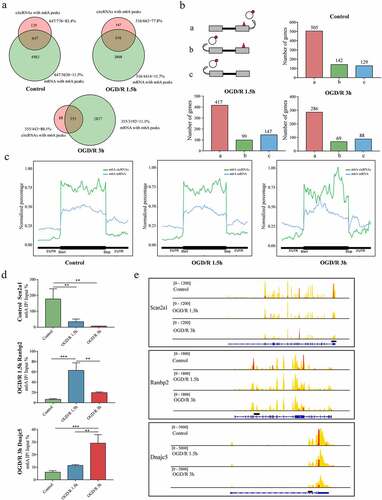
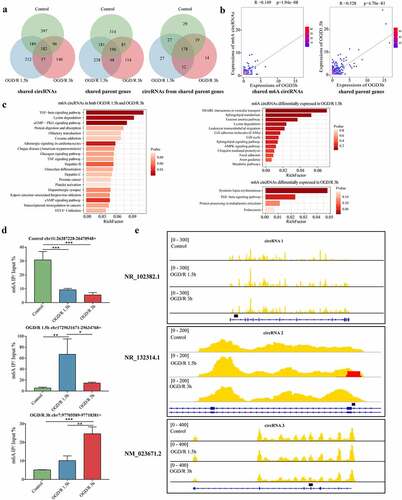
Figure 6. m6A circRNAs have time-specific methylation patterns with different OGD/R treatments. (a). Venn diagram showing the shared circRNAs, shared circRNA parent genes and circRNAs derived from those shared genes in the different OGD/R groups. The numbers of circRNAs are shown. (b). Two-dimensional histograms comparing the expression levels of the m6A circRNAs in the OGD/R 1.5 h and OGD/R 3 h groups. The colour represents the number of circRNAs expressed in both the OGD/R 1.5 h and OGD/R 3 h groups. (c). KEGG pathway analysis of the shared and specifically expressed m6A circRNAs in the OGD/R 1.5 h and OGD/R 3 h groups. (d). MeRIP qRT-PCR validation of m6A circRNAs specifically expressed in the control, OGD/R 1.5 h and OGD/R 3 h groups. (e). Visualization of specifically expressed m6A circRNAs in the control, OGD/R 1.5 h and OGD/R 3 h groups.