
Figures & data
Figure 1. Comparison of the genomic context of the MethylationEPIC v1.0 (850K) and v2.0 (900K) BeadChip microarrays and the newly added CpG probes. (a) Venn diagram showing the degree of overlap (dark blue) between 850K (light blue) and 900K (deep-dark blue) microarrays. (b) CpG density plot of the 22 autosomes, 1 sex chromosome pair and M chromosome of the human genome showing the number of new CpGs in 900K microarray within 1-Mb-sized windows. The horizontal axis represents chromosome length (Mb) and the different colours indicate CpG density. (c) Bar plots represent the percentage of CpG for each chromosome pertaining to the 850K and 900K microarrays and the new probes of the 900K microarray. (d) Stacked bar plot represent the percentage of the Infinium design chemistry (Infinium I or Infinium II) of the probes in the 850K and 900K microarrays and the new probes of the 900K microarray.
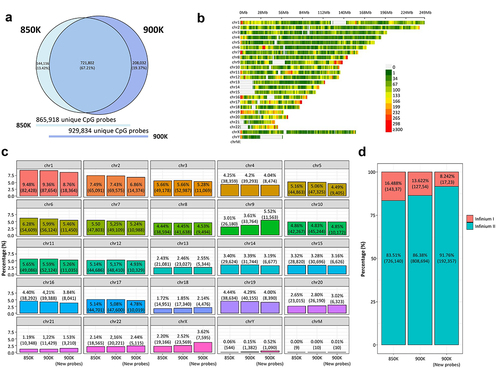
Figure 2. Comparison of the functional context of the MethylationEPIC v1.0 (850K) and v2.0 (900K) BeadChip microarrays and the newly added CpG probes. (a) Donut pie plot representing the percentage of CpG probes associated with RNA transcripts according to the GENCODE annotation in the 850K (top) and 900K (middle) microarrays and the new probes from the 900K (bottom) microarray. (b) Gene Ontology analysis of the additional transcripts in the 900K compared with the 850K microarray. The pathway name is indicated on the y-axis; the x-axis shows the ratio between observed and expected genes in a GO pathway. Bubble size and colour indicate the false-discovery rate (FDR): large blue and small red represent high and low values, respectively. (c) Bar plot representing the number of CpG probes in several annotation features of the microarray manifest: CpG probes in relation to gene (gene distribution) and CpG islands (CpG island distribution), and CpG probes associated with the different chromatin states model (chromatin state dynamics) and with CTCF-binding regions (CTCF-binding sites). Light, dark and deep-dark blue correspond to the 850K and 900K microarray probes and the new probes of the 900K microarray, respectively.
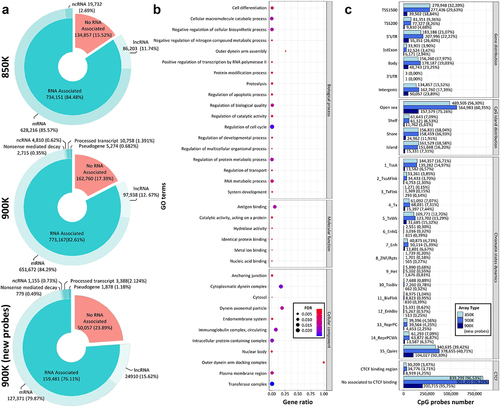
Figure 3. Technical and biological validation of the methylation profiles of the same samples hybridized in the MethylationEPIC v1.0 (850K) and v2.0 (900K) BeadChip microarrays. (a-d) Correlation plots of the CpG methylation values within (a) the same sample hybridized in the 850K and 900K microarrays; (b) technical replicate of the breast cancer primary sample; (c) technical replicate of the blood primary sample; and (d) consecutive fresh-frozen and formalin-fixed paraffin-embedded (FFPE) sections of normal endometrium primary tissue. At the bottom and to the left of each correlation graph, density plots show the methylation β-values corresponding to the sample on the x-axis (bottom plot) or the sample on the y-axis (left plot). At the bottom-left edge, density plots show the methylation differences between the two samples. (e) Biplot representing principal component (PC) 1 and PC2 of β-values of samples hybridized in the 850K (left) and 900K (middle) microarrays, and for the additional probes in the new 900K microarray (right). Colors represent the different tissues, dots indicate whether samples are primary tissue or cell line samples, and unfilled and filled dots represent healthy and tumoural tissue, respectively. (f) Biplot of the t-SNE analysis of samples hybridized in the 850K (left) and 900K (middle) microarrays and for the additional probes in the new 900K microarray (right). Colors represent the different tissues and dots indicate whether samples are primary tissue or cell line samples. (g) Unsupervised hierarchical analysis and heatmap for the 43 different samples hybridized in the 850K (left) and 900K (middle) microarrays and for the additional probes in the 900K (right) microarray. Colors indicate whether the sample is from primary tissue (normal or tumoural) and the tissue type, as described in the legend of the heatmap. Methylation β-values range from 0 (green) to 1 (red). (h) Dendrogram comparison of 43 samples hybridized in the 850K and 900K microarrays. Bold and coloured branches and lines between dendrograms indicate subtrees common to the two microarrays. Distinct edges in the 850K and 900K microarray dendrograms are shown as dashed branches.
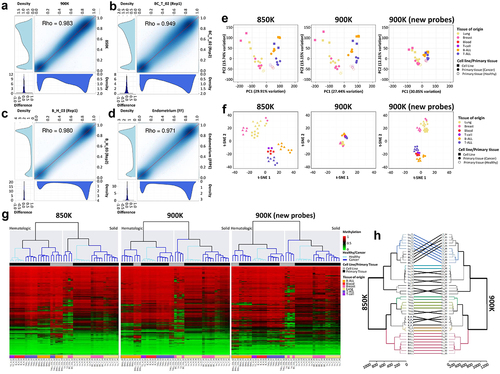
Table 1. List of samples used for the technical and biological validation of the Human MethylationEPIC v2.0 microarray.
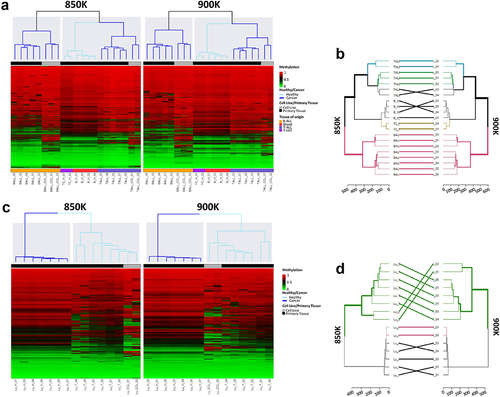
Figure 4. Unsupervised hierarchical analysis of methylation profiles of blood and lung sample revealed by the MethylationEPIC v1.0 (850K) and v2.0 (900K) BeadChip microarrays. (a) Unsupervised hierarchical analysis and heatmap from the 21 haematological samples hybridized in the 850K (left) and 900K (right) microarrays. Colors indicate whether the sample is from primary tissue (normal or tumoural) and the tissue type, as described in the legend of the heatmap. Methylation β-values range from 0 (green) to 1 (red). (b) Dendrogram comparison of 21 haematological samples hybridized in the 850K and 900K microarrays. Bold and coloured branches and lines between dendrograms indicate subtrees common to the two microarrays. Distinct edges to the 850K and 900K microarray dendrograms are shown as dashed branches. (c) Unsupervised hierarchical analysis and heatmap from the 15 lung samples hybridized in the 850K (left) and 900K (right) microarrays. Colors indicate whether the sample is from primary tissue (normal or tumoural) and the tissue type, as described in the legend of the heatmap. Methylation β-values range from 0 (green) to 1 (red). (d) Dendrogram comparison of 15 lung samples hybridized in the 850K and 900K microarrays. Bold and coloured branches and lines between dendrograms indicate subtrees common to the two microarrays. Distinct edges to the 850K and 900K microarray dendrograms are shown as dashed branches.
Supplemental Material
Download Zip (385.4 MB)Data availability statement
The complete DNA methylation data from 900K EPIC V2 are freely available on the GEO repository under accession number GSE222919 (https://www.ncbi.nlbm.nih.gov/geo/query/acc.cgi?acc=GSE222919).