Figures & data
Figure 1. The expression of NAT10 in CRC and other tumours.(a, d) by using the GEPIA database, results showed NAT10 expression in different tumour tissue and matched normal tissue.(b, c) NAT10 expression levels in different tumour cell lines. Data were obtained from CCLE.(e) Western Blot detected the NAT10 expression between normal colon cancer epithelial cells (NCM460) and other colon cancer cells (HT29` HCT116` SW480 and DLD1), and GAPDH expression was used to calibrate differences between groups.(f) the expression data of NAT10 in pathological sections come from the human protein atlas.(g) the expression data of NAT10 in pathological by IHC and the tissues are from Zhongnan Hospital of Wuhan university.
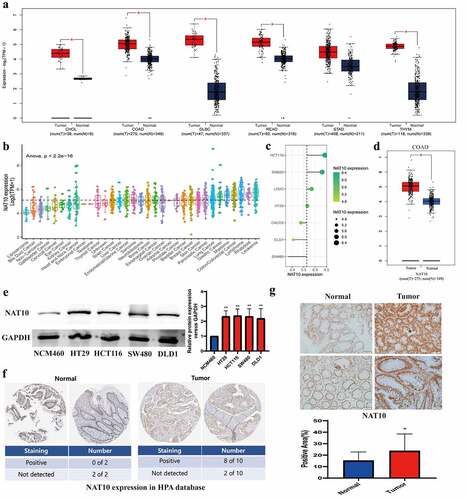
Figure 2. Biological functions of NAT10 in CRC.(a) KEGG analysis based on DEGs between High NAT10 and Low NAT10 CRC patients.(b) GSEA analysis between high and low expression of NAT10 gene group. ES means enrichment score. (c) Analysis of immune cell infiltration between high and low expression NAT10 groups by using the CIBERSORT algorithm. P < 0.05 is considered statistically significant.(d) CCK8 detected the proliferation ability of HCT116 and HT29 cells after NAT10 overexpression, and the data was the average value after repeated three times.
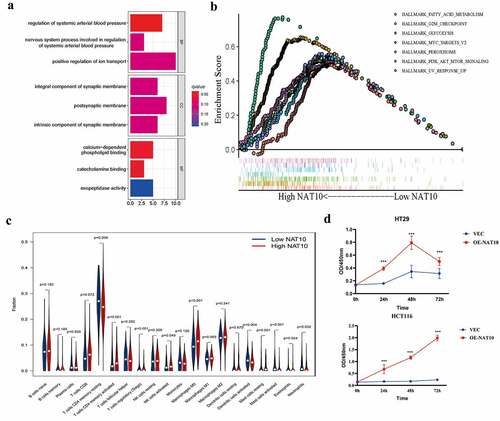
Figure 3. Identification of NAT10-related ac4C-DEGs in CRC. (a) the heatmap showed differential expression genes between normal and CRC tissues. |log(fold Change)| < 1 and p < 0.05 was considered as the thresholds for the differential gene expressions. We chose the expression of 5 genes (NAT10, LGR5, CLDN9, MYC, and MEX3A) to plot the heatmap. (b) Volcano plot showing the distribution of differential genes in the TCGA-COAD dataset between normal and CRC tissues. (c) the heatmap showed differential expression genes between high and low NAT10 groups. |log(fold Change)| < 1 and p < 0.05 was considered as the thresholds for the differential gene expressions. We chose the expression of 4 genes (LGR5, CLDN9, MYC, and MEX3A) to plot the heatmap. (d) Volcano plot showing the distribution of differential genes in the TCGA-COAD dataset between normal and CRC tissues. (e) the Venn diagram shows the intersection of genes between two groups C1 (DEGs of high and low NAT10 groups) and C2 (DEGs of normal and tumour) of differential genes.
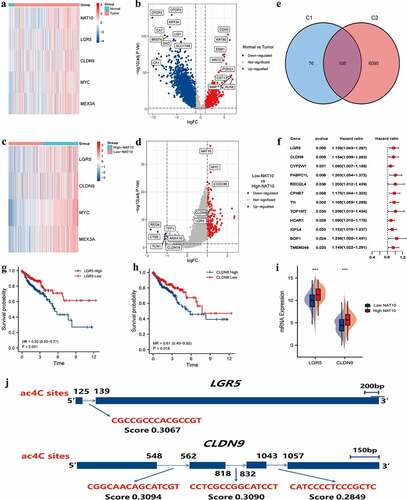
Figure 4. Prognostic model of NAT10.(a) LASSO coefficients profiles of 103 RNA acetylation genes. (b) LASSO regression with tenfold cross-validation obtained 13 prognostic genes using minimum lambda value. (c, d) Relationship between RNA acetylation risk score of colorectal cancer patients, survival analysis showed the OS between high-risk score group and low-risk score group, Log-rank P < 0.001.(e) the AUC curve was used to evaluate the model’s predictive ability. The higher the AUC result, the stronger the predictive ability, 1-Years AUC = 0.705.
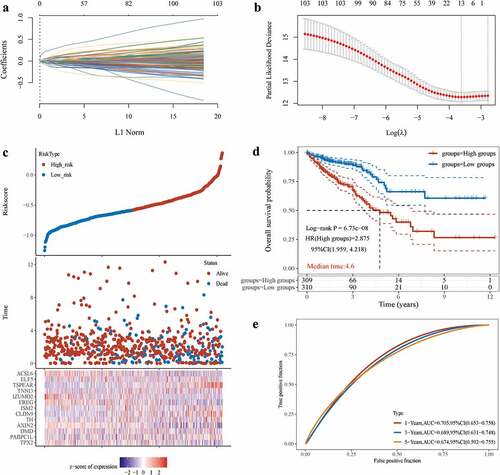
Figure 5. Tumour Microenvironment of ac4cscore Groups.(A) Pathway differences between high and low acetylation risk score groups using GSVA analysis, adj.P.value<0.05 is considered statistically significant.(b, C) ssGSEA Analysis of Differences in Immune Cell Infiltration Levels and low-risk groups. CIBERSORT was used to calculate and compare stromal scores, immune scores, and estimate scores in the high and low acetylation risk score groups.(d, E) the waterfall plot depicts SNV and INDL in patients in the acetylation risk score group(f) Compare TMB scores between high and low-risk groups, TMB is calculated as ‘number of somatic mutations/length of corresponding region.
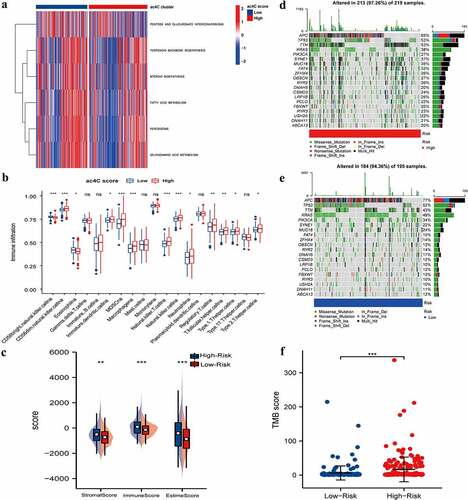
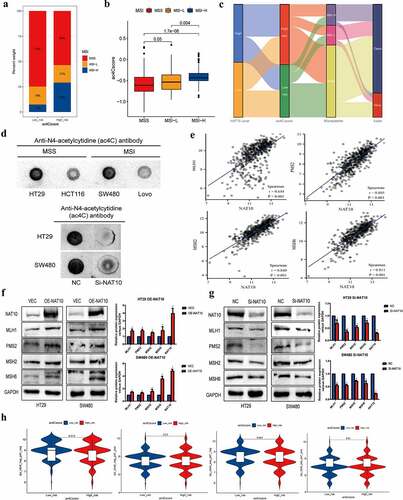
Figure 6. Ac4cscore and microsatellite instable (MSI) status in CRC.(a, b) the vertical stack bar gram showed the proportions of MSS` MSI-L and MSI-H in the high and low acetylation risk groups. Grouping histogram showing the differences in mRNA acetylation risk scores between different microsatellite statuses.(c) Alluvial diagram depicts the attribution of microsatellite status subtypes in the ac4cscore groups.(d) Detection of RNA acetylation level using RNA dot blot in MSS cell lines HT29, SW480 and MSI cell lines HCT116, Lovo. The total quality of RNA added to each spot is 5ug.(e) Correlation analysis reveals the association between NAT10 and MLH1` MSH2` PMS2 and MSH6.(f, g) NAT10 was overexpressed and knocked down in HT29 and SW480 cell lines respectively, and the expression of four mismatch repair proteins MLH1, PMS2, MSH2, MSH6 was detected by western blot.(h) Relationship between mRNA acetylation risk score and therapeutic response to PD-1 and CTLA4, the treatment response data from TCIA.