
Figures & data
Table 1. Clinicopathological characteristics of SHGH cohort.
Figure 1. Overexpression of KDM4B in ccRCC tissues. (a) Differential expression of 27 JMJD family genes in TCGA between tumour and adjacent normal tissues. (b) Differential expression of KDM4B in normal tissues, primary tumours and tumour thrombus in single-cell datasets. (c) qPCR analysis of KDM4B in paired samples. GAPDH was used as an internal control to normalize KDM4B mRNA expression. (d) Representative immunohistochemical staining of tissues with different expression levels of KDM4B. Left: normal tissue; Middle: low expression of KDM4B; Right: high expression of KDM4B.
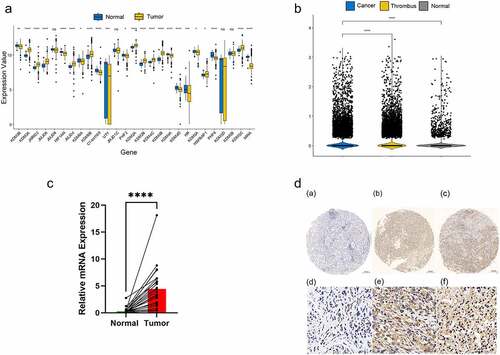
Figure 2. Relationship between KDM4B and clinicopathological features. (a) the relationship between KDM4B score and (a) stage, (b) tumour grade, (c) primary tumour, (d) lymph node metastasis, and (e) distant metastasis in the SHGH cohort. High stage: stage III, low stage: stage I and II. High grade: G3 and G4, low grade: G1 and G2. (b) Kaplan-–meier’s survival curve of SHGH cohort. High and low groups are determined by the mean KDM4B scores. (c) Kaplan – Meier’s survival curve of TCGA cohort. High and low groups are determined by the median KDM4B expression. *: p < 0.05, **: p < 0.01, SHGH: Shanghai General Hospital.
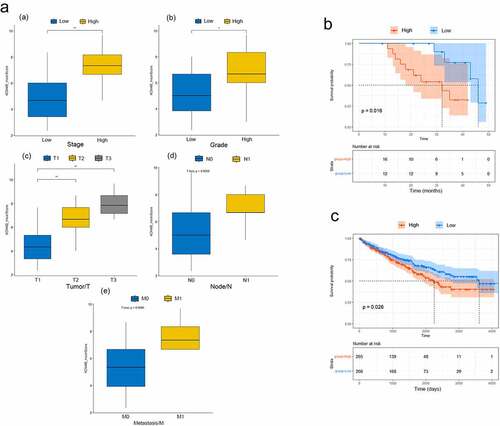
Figure 3. KDM4B promotes cell proliferation and migration. (a) Verification of overexpression and knockdown (a) 786-O and (b) Caki-1 cell lines by western blot analysis. (b) CCK-8 assays to assess cell growth. (a) KDM4B overexpressed 786-O; (b) KDM4B knockdown 786-O; (c) KDM4B overexpressed Caki-1; (d) KDM4B knockdown Caki-1. (c), (d) Transwell migration assay of 786-O cell lines. EV: empty vector.
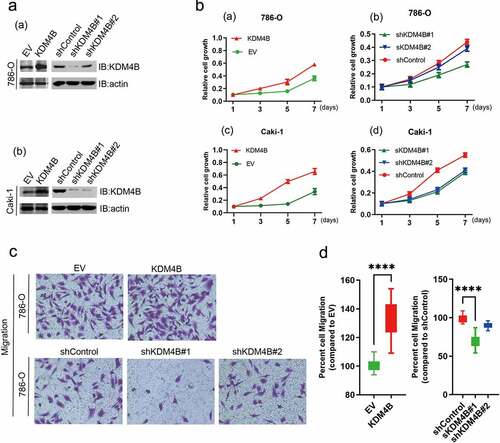
Figure 4. KDM4B promotes tumour growth and metastasis in vivo. (a) Tumors grown in xenograft mice from KDM4B overexpressed and control 786-O cell lines at 28 days. (b) Tumor growth curves of EV and KDM4B overexpressed groups. (c) Weight of KDM4B overexpressing tumours and control tumours of xenograft mice. (d) Representative IHC of xenograft tumours of (a) Control group and (b) KDM4B overexpressing group. (e) Livers from xenograft mice. Visible metastases on the liver are marked with arrows. (f) H&E staining of the livers. (a) Normal liver and (b) liver with metastasis. (EV: empty vector).
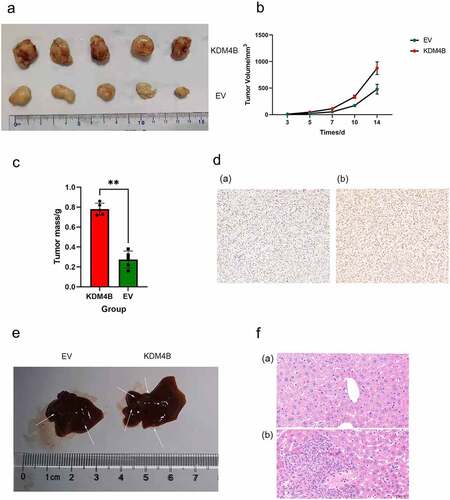
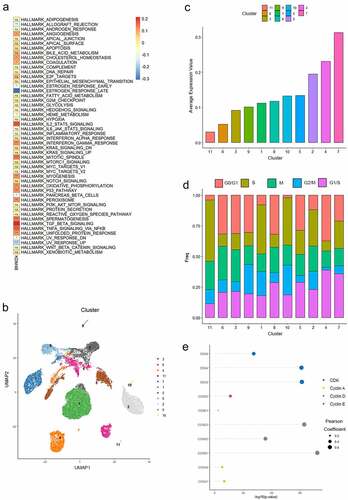
Figure 5. KDM4B and the progression of the cell cycle. (a) the correlation of KDM4B with ssGSEA results of 50 Hallmark gene sets of TCGA-KIRC datasets. (b) the UMAP plot shows 29,831 ccRCC cells were grouped into 11 clusters. (c) Mean KDM4B expression levels of different clusters. (d) the proportion of cells at different cell cycle stages in different clusters. (e) the correlation between the expression of KDM4B and cell cycle genes.
Supplemental Material
Download Zip (2.5 MB)Data availability statement
The data that support the findings of this study are available in TCGA at https://portal.gdc.cancer.gov/ and GEO at https://www.ncbi.nlm.nih.gov/geo/. Single-cell RNA sequencing data are available at https://ngdc.cncb.ac.cn/gsa-human with ID HRA000963.