Figures & data
Figure 1. RBMS1 is downregulated in HCC and low expression of RBMS1 correlates with poor HCC patient survival. (a) RT-qPCR analysis of RBMS1 expression in 25 cases paired HCC tissues and adjacent liver tissues. (b) Comparison of RBMS1 expression between patients with T stage 1–2 (T1+T2, n=25) and T stage 3–4 (T3+T4, n=12), detected by RT-qPCR. (c) Comparison of RBMS1 expression between patients with TNM stage I-II (n=23) and TNM stage III-IV (n=14), detected by RT-qPCR. (d) Western blotting analysis of RBMS1 expression in HCC tissues and normal liver tissues. (e, f) Representative images and statistics of IHC staining of RBMS1 in HCC tissue of T stage T1 and T3 and clinical TNM stage I and III. Scale bar, 50 µm. (g) Kaplan–Meier analysis of correlation between RBMS1 expression and OS, RFS. (h) Forrest plot of univariate or multivariate Cox proportional hazard regression indicated the impact of different characteristics on OS and RFS. Data are denoted as mean ± SD from three independent experiments.
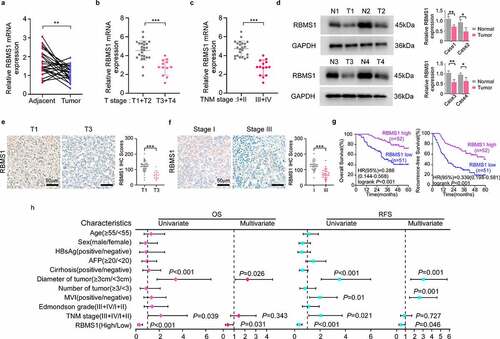
Figure 2. RBMS1 overexpression promotes ferroptosis in HCC cells. (a) RT-qPCR analysis for the expression of RBMS1 in normal liver cell line and HCC cell lines. (b) RT-qPCR analysis of efficiency of RBMS1 overexpression in HepG2 and Hep3B cell lines, compared to empty vector. (c) Western blotting of analysis of RBMS1, GPX4, and SLC7A11 expression in HepG2 and Hep3B as indicated treatments. (d) Half-life of GPX4 mRNA after treatment with ActD in HepG2 and Hep3B cells with or without RBMS1 overexpression. (e) Schematic of GPX4 luciferase reporter plasmids. GPX4-RLuc-FL (the full length of 3’-UTR); GPX4-RLuc-D1 (1–69 nt region of 3’UTR); and GPX4-RLuc-D2 (70–139 nt region of 3’UTR). (f-g) The relative luciferase activity of HepG2 and Hep3B cells with or without RBMS1 overexpression after transfecting GPX4-RLuc-FL (f), GPX4-RLuc-D1, and GPX4-RLuc-D2 (g) luciferase reporter vectors. (h) Representative images of H2DCFDA staining (green) and quantification of ROS level in HepG2 and Hep3B cells. Scale bar, 5 µm. (i) The assessment of MDA level in HepG2 and Hep3B cells. (j) Relative cell viability of HepG2 and Hep3B cells with or without RBMS1 overexpression after treated with erastin, ferrostatin-1, or both combined compared to corresponding control group. (k) Immunohistochemistry staining and correlation analysis of protein levels of RBMS1, GPX4, and 4HNE in clinical HCC samples. Scale bar, 50 µm. Data are denoted as mean ± SD from three independent experiments.
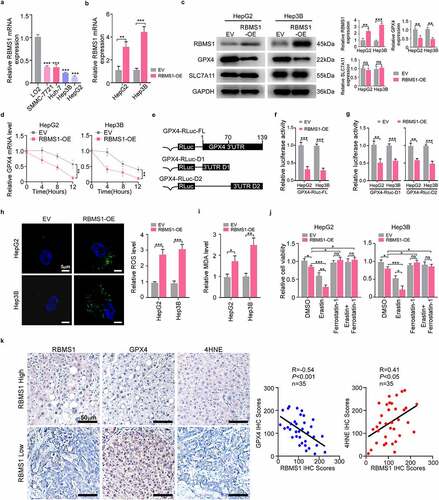
Figure 3. GPX4 rescues the inhibiting proliferation effect of HCC cells induced by RBMS1 overexpression in vitro and in vivo. (a) Western blotting analysis of RBMS1 and GPX4 expression in RBMS1-overexpressed HepG2 and Hep3B cells with or without GPX4 overexpression, compared to vector control. (b-d) Effects of RBMS1 overexpression with or without GPX4 overexpression on the proliferation of HepG2 and Hep3B cells were, respectively, assessed by CCK-8 assay (b), colony formation assay (c), and EdU staining (d), scale bar, 20 µm. (e-g) Hepa 1–6 cells (transduced with empty vector lentivirus, or vector overexpressing RBMS1 withor without overexpressing GPX4) were subcutaneously injected into the right flank of C57BL/6 mice. RT-qPCR analysis for the expression of RBMS1 and GXP4 in Hepa 1–6 cells (e). Tumor growth was monitored by Xenogen IVIS 200 imaging system (f). Western blotting analysis for the expression of RBMS1, GPX4, and 4HNE in Hepa 1–6 cells (g). Data are denoted as mean ± SD from three independent experiments.
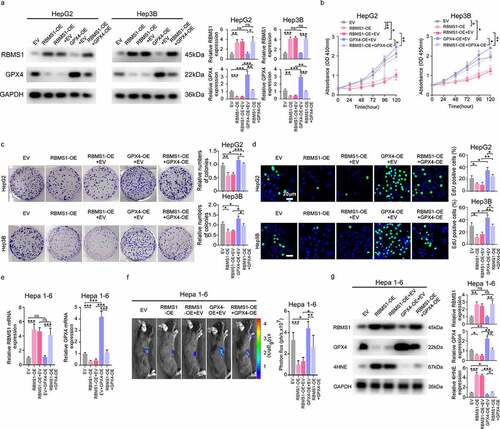
Figure 4. MiR-19b-3p inhibits ferroptosis and potentiates proliferation of HCC cells by repressing RBMS1 expression. (a) Prediction of miRNAs targeting RBMS1 by miRmap, PicTar, TargetScan, and PITA databases. (b) The expression of miR-19a-3p, miR-19b-3p, miR-124-3p, miR-129-5p, miR-376-3p, miR-383-5p, miR-487a-3p, and miR-501-3p in HCC and normal liver tissues through TCGA database. (c, d) RT-qPCR and western blotting analysis for the expression of RBMS1 in HepG2 and Hep3B cells after transfecting miR-19b-3p inhibitor. (e) Schematic diagram of luciferase reporter vector containing wild-type (WT) or mutant (MUT) putative miR-19b-3p binding sites of the 3’ UTR of RBMS1. (f) The dual luciferase reporter assays demonstrated that miR-19b-3p inhibitor influenced the luciferase activity of luciferase reporter vectors containing WT or MUT 3’UTR of RBMS1. (g, h) RBMS1 knockdown plasmids were added to the basis of miR-19b-3p inhibitor transfection in HepG2 and Hep3B cells. The ROS and MDA level were measured as indicated treatments. (i) Proliferation of HepG2 and Hep3B cells as indicated treatments was evaluated by colony formation assay. (j) RBMS1, GPX4, and 4HNE expression in HepG2 and Hep3B as indicated treatments was evaluated by western blotting. Data are denoted as mean ± SD from three independent experiments.
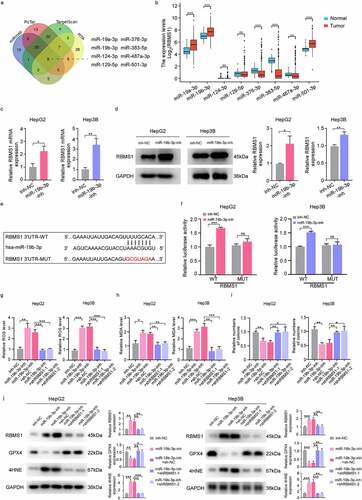
Figure 5. CircIDE directly binds to miR-19b-3p in HCC cells. (a) Identification the potential circRnas acted as miR-19b-3p sponge through Starbase, GSE155949 and GSE156088 datasets. (b) Schematic diagram of luciferase reporter vectors containing wild-type (WT) or mutant (MUT) putative miR-19b-3p binding sites of circIDE. (c) The relative luciferase activity of HepG2 and Hep3B cells co-transfected with WT or MUT circIDE luciferase reporter vectors and miR-19b-3p inhibitor or mimic. (d) CircRNA pull-down using biotin-coupled circIDE compared to control-biotin. MiR-19b-3p expression was detected by RT-qPCR. (e) Co-localization of circIDE and miR-19b-3p were detected by FISH assay. Scale bar, 5 µm. (f) Genomic loci of the IDE gene and circIDE blue dot indicated the back-splicing of IDE exon 2 to exon 4. (g-h) Half-life of IDE and circIDE after treatment with ActD in HepG2 and Hep3B cells. (i) Relative expression of IDE and circIDE in HepG2 and Hep3B cells with or without RNase R treatment was examined by RT-qPCR. (j-k) Results of cytoplasmic and nuclear RNA fraction assays. β-actin and U6 were used as cytoplasmic and nuclear positive controls, respectively. (l) RT-qPCR analysis of circIDE expression in HCC tissues and paired adjacent normal liver tissues (n=25). (m) Kaplan–Meier analysis of correlation between circIDE expression and OS, RFS. Data are denoted as mean ± SD from three independent experiments.
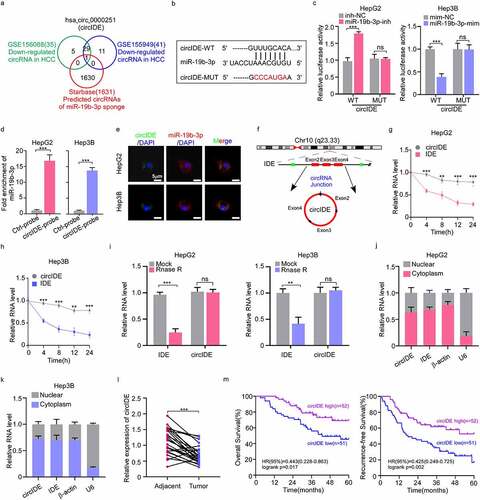
Figure 6. CircIDE enhances ferroptosis and attenuates proliferation of HCC cells via miR-19b-3p/RBMS11 axis. (a-e) After circIDE overexpression, HepG2 and Hep3B cells were transfected with miR-19b-3p mimic or RBMS1 knockdown plasmid, respectively. (a, b) Western blotting analysis of RBMS1, GPX4, and 4HNE expression in HepG2 and Hep3B as indicated treatments. (c, d) the assessment of ROS and MDA level in HepG2 and Hep3B cells as indicated treatments. (e) Proliferation of HepG2 and Hep3B cells as indicated treatments was evaluated by EdU staining. Scale bar, 20 µm. Data are denoted as mean ± SD from three independent experiments.
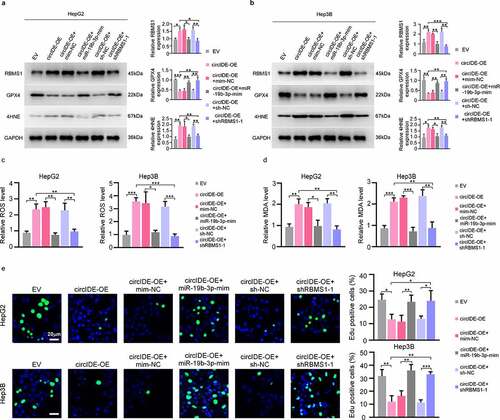
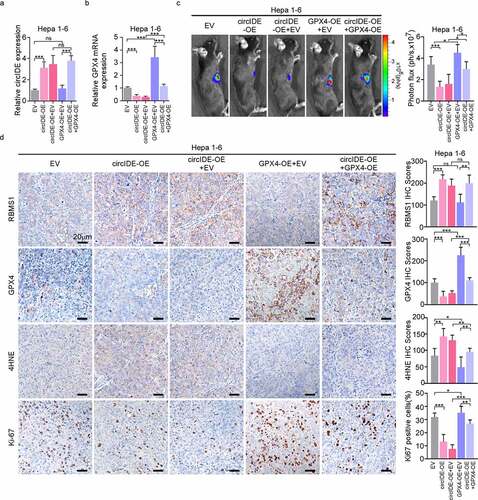
Figure 7. GPX4 overexpression restores circIDE induced inhibition of tumor growth. (a, b) RT-qPCR analysis of circIDE and GPX4 expression of circIDE overexpression of Hepa 1–6 cells with or without GPX4 overexpression, compared to vector control. (c) Tumor growth was monitored by Xenogen IVIS 200 imaging system. (d) Representative IHC staining and corresponding statistics for RBMS1, GPX4, 4HNE and Ki67 expression in the xenografts tumors. Scale bars, 20 µm. Data are denoted as mean ± SD from three independent experiments.