
Figures & data
Figure 1. Study design and HCM methylation landscape. (a) HCM samples were obtained during septal myectomy. Twenty-four HCM and eight normal control samples were used for DNAme data collection. Sixteen HCM and seven normal control samples were used for RNA-seq data collection. Differential methylation, differentially expressed gene, and combinatorial analyses were performed to identify key genes and pathways in HCM pathogenesis. (b) Representative images of histological results. HE staining and Masson’s staining results of LV from HCM patients and normal control. Scale bar, 50 μm. (c) Principal component analysis (PCA) of DNAme in 32 samples revealed overall differences between HCM and normal samples. (d) β-value density distribution. HCM myocardium harboured hypomethylated and hypermethylated DNA. (e) △β-value distribution and range of DMPs; −0.29 to−0.1 for HCMhypo DMPs and 0.1 to 0.34 for HCMhyper DMPs. (f) DMP distributions in gene models. (g) DMP distributions in CpG islands (CGIs) (h) DMP distributions across autosomes. Red and blue lines on each chromosome indicate hypermethylation and hypomethylation sites, respectively. Heatmap at the bottom shows the significance of HCMhyper DMP and HCMhypo DMP enrichment for each chromosome. Scaled colour bar = p-value. (i) DMP methylation levels in 32 samples. Scaled colour bar = β-value.
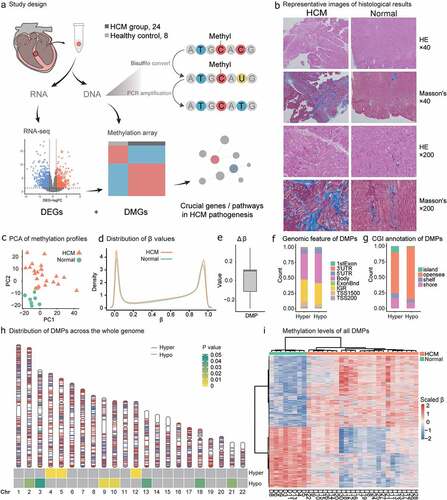
Table 1. Clinical characteristics of HCM patients.
Figure 2. Differentially expressed genes (DEGs) in HCM and DEGs and DMP gene enrichment analyses. (a) PCA of gene expression profiles for all 32 samples. (b) DEGs with high/low expression. Compared with healthy samples, HCM samples had 554 downregulated and 351 upregulated genes. (c) DMP transcription levels in HCM and healthy groups. Scaled colour bar = FPKM values. (d) GSEA of DEGs related to the ‘innate immune system’ and ‘adaptive immune system.’ DMMT transcriptional levels. No significant intergroup differences were observed in our data (e) or GSE130036 public dataset (f). No transcriptional changes were observed for TETs in our data (g) or GSE130036 public dataset (h). (i) Functionally grouped networks of DEG and DMP gene-enriched GO items in enrichment analysis of both gene sets. (j) Fifteen most significant KEGG-enriched pathways of DEGs and DMP genes. Circle size is proportional to the number of genes in the pathway. Color represents P-value.
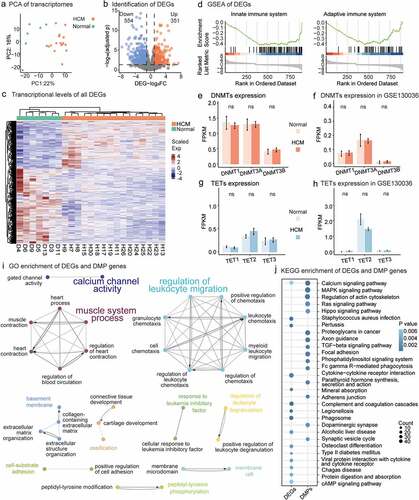
Figure 3. Relationship between gene methylation and transcription and results of xCell analysis. (a) PPI networks of HCM DEGs harbouring DMPs. PPIs network of 79 DEGs affected by DNAme alterations consisted of two major clusters. A larger cluster harboured genes related to tissue and organ growth and development and was associated with genes regulating immune functions such as ESR1, STC2, TGFA, TGFB2, and VEGFC. (b) Twenty-five DEGs with regulatory DNAme alterations. CpG hypermethylation in gene promoters downregulates gene transcription (orange dots). CpG hypermethylation/hypomethylation in the gene body indicates/downregulates active gene transcription (green dots). Estimation of immune cell composition. Immune cells with distinct enhancement scores in HCM myocardium compared with normal tissue in xCell analysis are shown with their significance levels (*P value<0.05, **P value<0.01, ***P value<0.001) for our data (c) and GSE130036 public dataset (d). Immune cells arranged in order ‘Myeloids,’ ‘Stromal cells,’ ‘Stem cells,’ ‘Lymphoids,’ and ‘Others’.
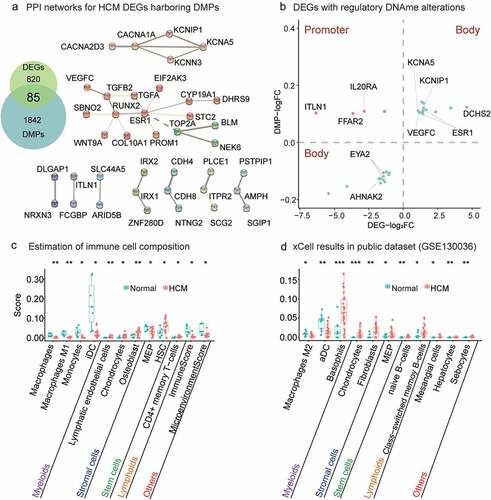
Table 2. DNA methylation and transcriptional changes of important genes.