
Figures & data
Figure 1. Quantified the cellular composition of peripheral blood cells. (a) Six immune cells of peripheral blood in stage I. (b) Six immune cells of peripheral blood in stage II.
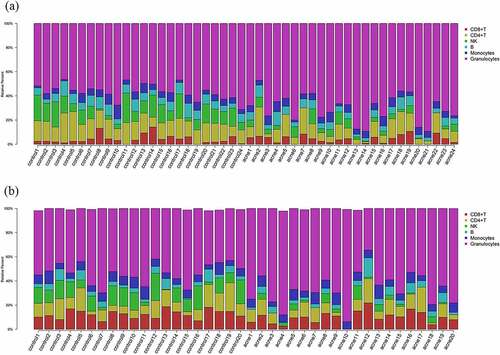
Figure 2. Differences in six immune cells in blood were compared between patients and healthy controls. (a) Differences in stage I. (b) Differences in stage II.
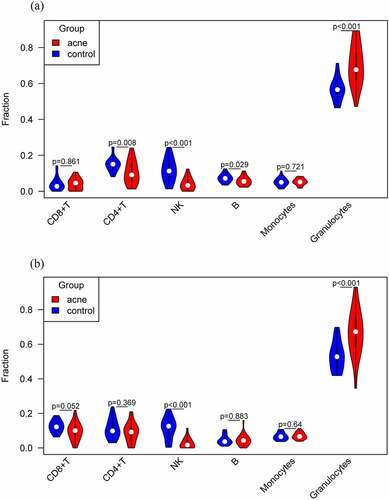
Figure 3. QQ plot to assess whether the epigenome-wide association results were robust to analysis on M-values instead of β-values.
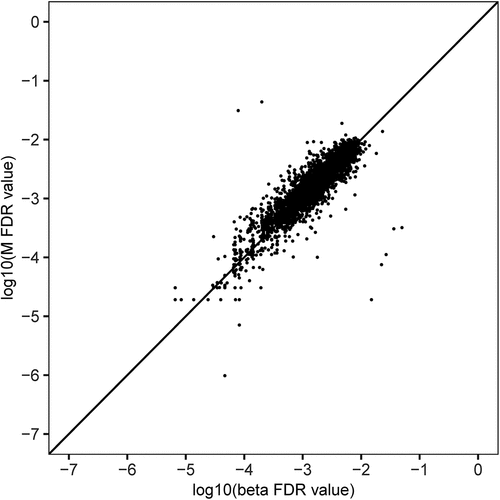
Table 1. Meta-analysis results of differential methylation sites of severe acne in stage I and stage II.
Supplemental Material
Download Zip (1.4 MB)Data availability statement
Datasets related to this article have been deposited in the OMIX, China National Center for Bioinformation/Beijing Institute of Genomics, Chinese Academy of Sciences (https://ngdc.cncb.ac.cn/omix: accession no. OMIX704, and OMIX706).