
Figures & data
Figure 1. Illustration of the study design. MSP-PCR: Methylation-specific polymerase chain reaction. Created with BioRender.Com.
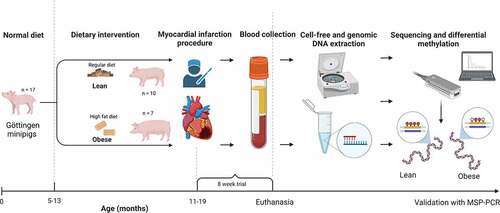
Figure 2. Violin plot of log-likelihood ratios (LLR) of methylation of the 1,236 cell-free DNA (cfDNA) differentially methylated regions (DMRs) significantly associated with obesity. A Wilcoxon non-parametric test was used to compare the distributions of LLR between the two groups.
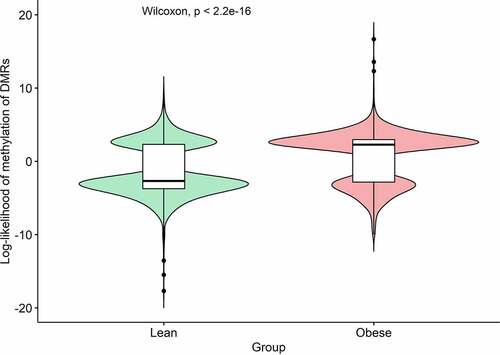
Figure 3. Genomic plots showing Oxford Nanopore sequencing data for the four differentially methylated regions (DMRs, blue highlights) obtained from cell-free DNA (cfDNA) and selected for validation by methylation-specific PCR. Each DMR was named by their closest genes of A: TUB and RIC3, B: PPARGC1B, C: GAS6 and D: EVL. Bottom X-axis indicates the number of CpG positions in the region. Lower window indicates the aggregated log-likelihood ratio (LLR) of the methylation of the CpG position, where 1 is highest probability of methylation. Middle Rawstat window indicates the raw computed test statistic for each cfDNA read obtained from Nanopolish, where positive indicates methylation and negative indicates unmethylation. The upper window shows each individual sequenced cfDNA read with identified CpG position illustrated as circles. A closed circle indicates methylation, whereas open circle indicates unmethylation. Top X-axis indicates genome coordinates in base pairs, with chromosome number in top left corner. Red: obese pigs. Green: lean pigs. Blue highlights: DMRs.
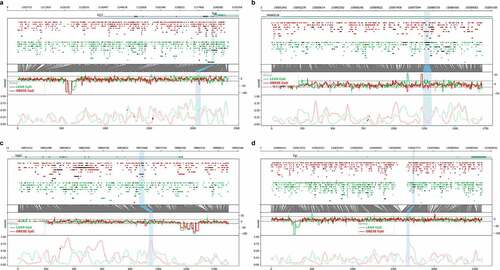
Table 1. Top 10 cfDNA DNA DMRs associated with obesity presented with genomic coordinates, false discovery rates (FDR), their nearest gene(s) according to their genomic coordinates and top disorder associated with the human gene analogue (obtained from MalaCards). MSP-PCR column indicates DMRs selected for bisulphite conversion and MSP-PCR validation.
Table 2. Types of genes associated with TSS located near or within significant DMRs from circulating cfDNA analysis associated with obesity.
Figure 4. Validation of four differentially methylated regions (DMRs) associated with obesity by bisulphite conversion of cell-free DNA (cfDNA) and subsequent methylation-specific PCR (MSP-PCR) throughout the two experimental groups. Methylation ratios were obtained from the MSP-PCR procedure. Positive Y-axis value indicates methylation, negative Y-axis value indicates unmethylation. P values were obtained from a non-parametric Wilcoxon test.
Figure 5. Spearman correlations between methylation-specific PCR (MSP-PCR) ratios (Y-axis) and body weight of all 17 pigs for four differentially methylated regions (DMRs) associated with obesity. Positive Y-axis value indicates methylation, negative Y-axis value indicates unmethylation.
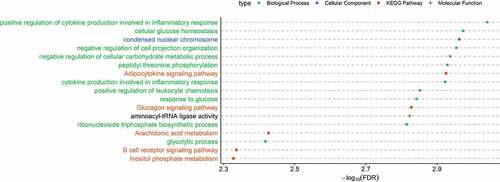
Figure 6. Significantly enriched (FDR<0.05) GO and KEGG pathways associated with obesity found from the transcription start sites (TSS) located near or within the differentially methylated regions (DMRs) of cell-free DNA (cfDNA). X-axis indicates -log10(FDR) obtained from ClueGO. Y-axis indicates GO term and/or KEGG pathways (green circle: biological process; blue triangle: cellular component; orange square: KEGG pathways; plus sign: molecular function).
Supplemental Material
Download Zip (1.2 MB)Data availability statement
All sequencing and methylation data from cell-free DNA samples supporting the findings of this paper are available in the National Centre for Biotechnology Information (NCBI) Sequence Read Archive (SRA) under the BioProject ID: PRJNA903387. Available from link: https://www.ncbi.nlm.nih.gov/sra/PRJNA903387.