
Figures & data
Figure 1. Cytosine methylation levels in CpG context.
(A) Distribution for X. tropicalis of three different age groups and human mammary epithelial tissue. For each X. tropicalis age group the average of three different individuals. Common sites with at least 5× coverage were used. The human mammary epithelial dataset is from ENCODE (doi:10.17989/ENCSR656TQD, file ENCFF699GKH).
(B) CpG methylation distribution over chromosomes for each age group (average of all samples within the same group). Vertical gold bars represent centromere positions. Common sites for all samples with at least 3× coverage were used. Resolution 500Kb.
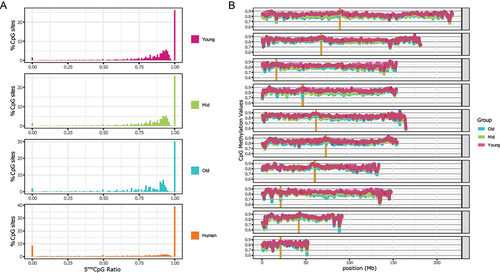
Table 1. Average 5meC (%) by dinucleotide context.
Figure 2. CpG methylation distribution over genomic features.
(A) Gene metaplot with upstream and downstream 2Kb. In the inset, a zoom in of the central part of the gene body (from the second decile to the TTS).
(B) Gene body CpG methylation in repeated elements bigger than 1Kb [not distinguished by class nor family].
(C) Principal Component Analysis (showing PC1 vs. PC2) using CpG methylation levels for the nine frog samples. CpG sites with at least 5× coverage were used and filtered to remove the variables with low variance (PCAtools, removeVar = 0.1).
(D) CpG methylation preliminary clock leave-one-out predictions. Each point represents the age prediction on one sample from an elastic net model which was trained on the other eight samples. For all panels, common sites for all samples with at least 5× coverage were used. The boxplots in the insets show the mean of the distribution.
![Figure 2. CpG methylation distribution over genomic features.(A) Gene metaplot with upstream and downstream 2Kb. In the inset, a zoom in of the central part of the gene body (from the second decile to the TTS).(B) Gene body CpG methylation in repeated elements bigger than 1Kb [not distinguished by class nor family].(C) Principal Component Analysis (showing PC1 vs. PC2) using CpG methylation levels for the nine frog samples. CpG sites with at least 5× coverage were used and filtered to remove the variables with low variance (PCAtools, removeVar = 0.1).(D) CpG methylation preliminary clock leave-one-out predictions. Each point represents the age prediction on one sample from an elastic net model which was trained on the other eight samples. For all panels, common sites for all samples with at least 5× coverage were used. The boxplots in the insets show the mean of the distribution.](/cms/asset/9665c300-608d-4079-912c-7ee9749fd9c6/kepi_a_2201517_f0002_oc.jpg)
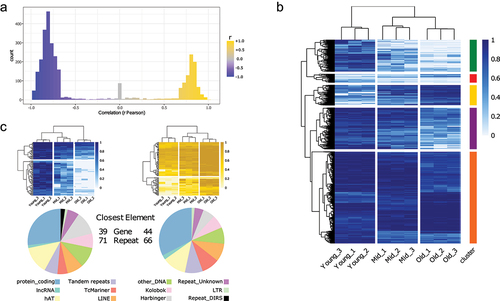
Figure 3. Selection of CpG sites correlated with age.
(A) Pearson correlation (r) distribution of the approximately 3400 CpG sites selected.
(B) CpG methylation levels of the selected sites (same as in A). Sites are grouped in five clusters, based on the clustering (method = ‘complete’).
(C) CpG methylation levels of the top 100 sites correlated with age (right, gold), and anti-correlated (left, blue) (top). Distribution of the closest genomic elements (both genes and repeats) for each site (bottom).
Supplemental Material
Download Zip (1.7 MB)Data availability statement
Data are publicly available at the NCBI Gene Expression Omnibus SuperSeries GSE222108 (https://www.ncbi.nlm.nih.gov/geo/). The SuperSeries is composed of two SubSeries: GSE221656 for WGBS and GSE222107 for TBSeq.