
Figures & data
Table 1. Primer sequences for real-time quantitative PCR.
Figure 1. Changes in the serum aminotransferase levels and inflammatory cytokine production in hepatic IR injury. (a) Serum ALT and AST levels were detected by an automatic analyser during the sham and IR processes. (b) the proinflammatory cytokines (TNF, IL-6 and MIP-2) were measured using an ELISA kit. The results are expressed as the mean ± SD of 5 animals per group. *Significant difference from the sham group, P < 0.05.
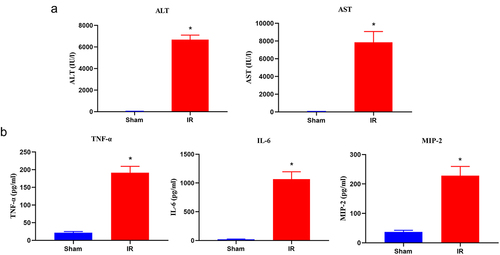
Figure 2. Histopathological changes and m6A level of total RNA in hepatic IRI. (a) Representative photographs (100×) of H&E-stained liver sections were taken from the mice subjected to the sham and IR processes, and histopathological scoring of hepatic injury was performed. Scale bar: 200 μm. (b) Representative photographs (200×) of liver sections stained by TUNEL were taken from the mice subjected to the sham and IR processes, and TUNEL-positive cells were counted as described in the Materials and Methods. Scale bar: 25 μm. (c) DNA fragmentation and the activity of caspase 3 in the liver tissues were measured by ELISA (n = 5). (d) Hepatic IR injury significantly upregulated the total RNA of m6A in liver tissues. Data are shown as the mean ± SD of 5 animals per group. *Significant difference from the sham group, P < 0.05.
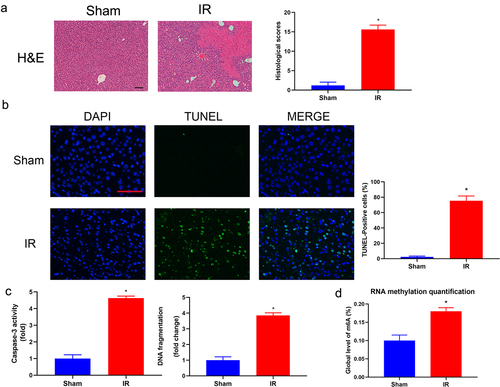
Figure 3. Overview of N6-methyladenosine methylation within mRnas in the hepatic IR and sham groups. (a) Venn diagrams showing m6A methylation-related transcripts (a) and m6A methylation-related genes (b) between IR and sham group. (b) Volcano plots showing the significantly differential m6A peaks in the hepatic IR group compared with the sham group (fold changes≥1.5 and p ≤ 0.05). (c) Metagene plots showing the accumulation of the region of average m6A peaks across the length of mRNA transcripts. (d) Pie charts showing the differentially methylated m6A peaks between the IR and sham groups. (e) Sequence logo showing the top motifs enriched across m6A peaks. (f) the relative occupancy of differentially methylated m6A peaks in mouse chromosomes.
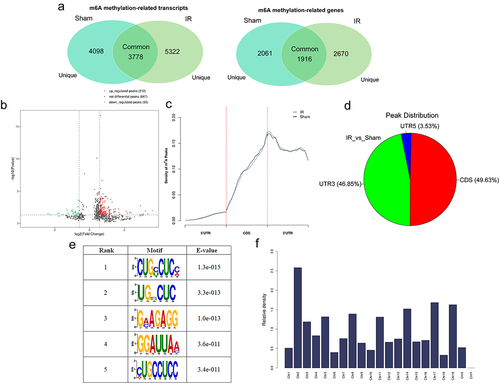
Figure 4. GO and KEGG analyses of coding genes with modulated m6A peaks in the hepatic IR vs. sham groups. (a) the top ten significant GO enrichment terms for the upmethylated genes. (b) the top ten significant GO enrichment terms for the downmethylated genes. (c) the top ten enrichment scores of the enrichment pathway for the upmethylated genes. (d) the top ten enrichment scores of the significant enrichment pathway for the downmethylated genes.
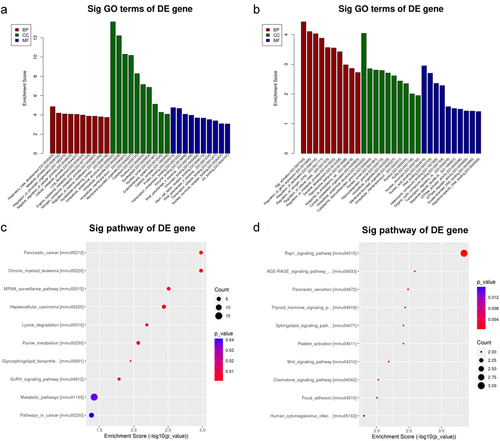
Figure 5. Analysis of RNA-sequencing data of hepatic IRI in mice. (a) Volcano plots showing differentially expressed genes in hepatic IR groups compared with sham groups (log2FC ≥ 0.585/log2FC ≤ −0.585 and p ≤ 0.05). (b) Heatmap plots showing the differentially expressed genes in the hepatic IR and sham groups. (c) Three-dimensions scatter graph showing the predicted new transcripts by coding potential assessing tool. (d) Four-quadrant graph exhibiting the distribution of mRnas with significant alterations in both m6A-modified level and corresponding mRNA expression between the IR and sham groups (|log2 FC| > 1.5, p < 0.05).
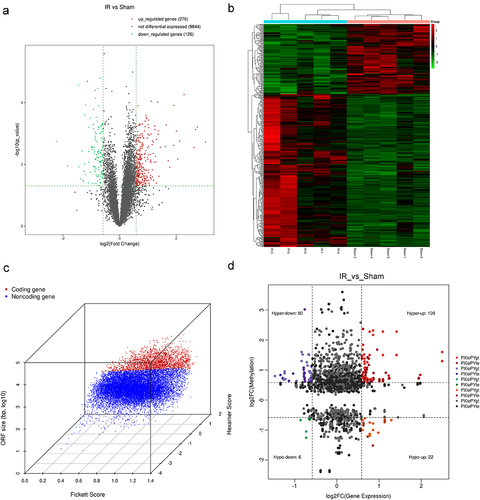
Figure 6. Analysis of differential mRnas with differentially methylated m6A peaks. (a) Screening strategy of m6A-regulated target genes (Phldb2, Fnip2, and Pcf11). (b-d) the m6A abundances on mRNA transcripts and location of the chromosome as detected were plotted by MeRIP-seq. (e) MeRIP-Qpcr validation of m6A-regulated genes (Phldb2, Fnip2, and Pcf11) between the IR and sham groups. (f) the mRNA levels of Phldb2, Fnip2, and Pcf11 by real-time qRT‒PCR. *p < 0.05. Data are shown as the mean ± SD of three independent experiments performed in triplicate.
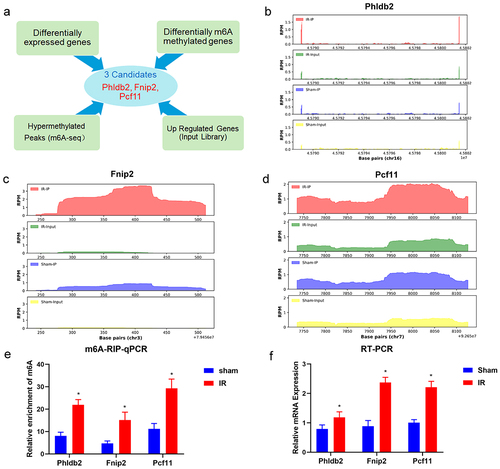
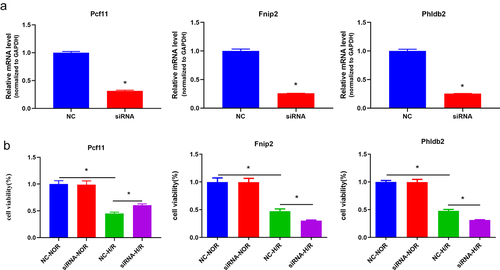
Figure 7. The m6A-regulated genes (Fnip2, Phldb2, and Pcf11) deficiency regulates hepatic IRI in vitro. (a) Qrt-PCR analysis showed a decreased expression of m6A-regulated genes in the mouse primary hepatocytes. *p < 0.05. (b) Cell viability was detected with CCK8 assay. *p < 0.05. Data are shown as the mean ± SD of three independent experiments performed in triplicate.
Supplemental Material
Download Zip (18 MB)Data availability statement
The data used to support the findings of this study are available from the corresponding author upon request. MeRIP-seq and RNA-seq data that support the findings of this study have been deposited in the Gene Expression Omnibus (GEO) database (https://www.ncbi.nlm.nih.gov/geo/), accession codes GSE190216.