
Figures & data
Table 1. Summary of Representative Genomic Regions Used in Power Simulation.
Figure 1. Absolute Correlations between probes in Region 1.
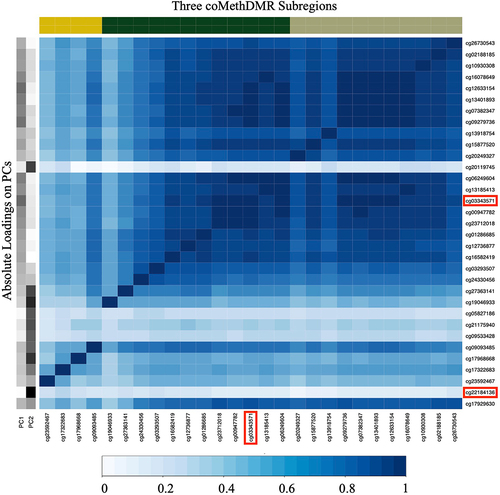
Table 2. Comparison of Numbers of Regions and DMRs Reported by DMRPC and coMethdmr.
Figure 2. The Genome-wide False Positive Rates on Genic Regions using 100 Discovery Cohort Subjects.
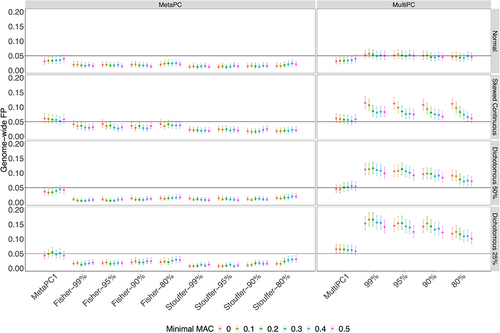
Figure 3. The Genome-wide False Positive Rates on Genic Regions using All Discovery Cohort Subjects (n = 528).
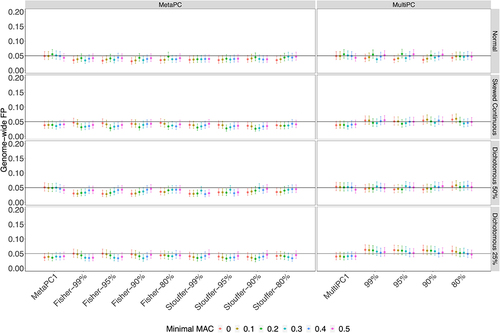
Figure 4. The True Positive Rates for Continuous Signals on Representative Regions: a.Region 1; b. Region 2; c. Region 3.
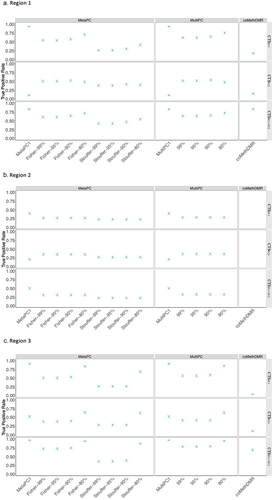
Table 3. Replicate ‘Novel’ DMRs without EWAS Hits in the Discovery cohort that were only identified by DMRPC or coMethdmr.
Table 4. Comparison of Relative Computational Burden between DMRPC and coMethdmr.
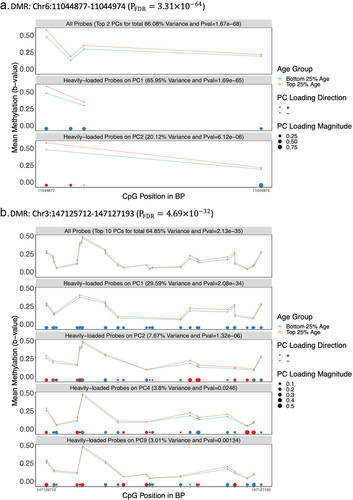
Figure 5. Visualization of Two Age-related DMRs in the Discovery Cohort a.DMR: Chr6:11044877 –11,044,974 (). b.DMR: Chr3:147125712 –147,127,193 (
).
Supplemental Material
Download MS Word (573.6 KB)Data availability statement
The datasets analysed during the current study are not publicly available. Qualified investigators can apply to the PTSD Genetics and TRACTS data repositories to gain access to these data via a Data Use Agreement. Please contact Dr. MW Miller regarding access to methylation data from PTSD Genetics and TRACTS data repositories.