
Figures & data
Figure 1. Repeated DNA damage increases cell survival and invasive potential. A) 22Rv1 cells were treated daily with 1 μg/ml of phleomycin for 6 weeks (6WP) or left untreated (WT, AM). A total of 1000 cells were treated with the indicated concentrations of phleomycin for 1 hour. Colonies were stained following 12 d of growth and percentage survival was calculated. The mean and SEM of three biological replicates is shown. Significance was determined by two-way ANOVA and Sidak’s post-test. *P < 0.05. B) WT, AM and 6WP cells were grown on chamber slides, scratched, and imaged at 0 and 48 hours. Results represent the percentage of the scratch width covered by migration at 48 hours relative to 0 hours. The mean and SEM of 3 biological and 3 technical replicates are shown. Significance was determined using a Student’s one-tailed t-test. *** P < 0.0001. C) Immunofluorescence staining for γH2A.X foci (FITC) in WT and 6WP cells following recovery from phleomycin-induced DNA damage at the indicated time points.
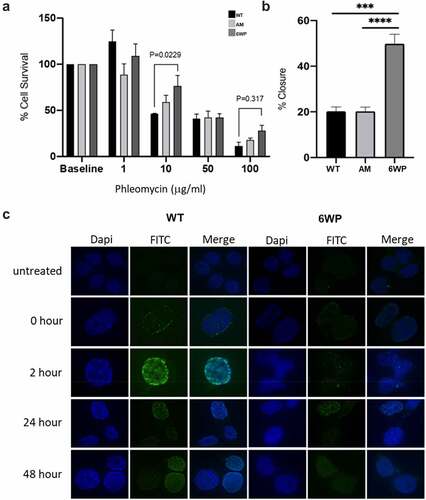
Figure 2. Repeated DNA damage in 22Rv1 cells increases DNA methylation. 22Rv1 cells were treated daily with 1 μg/ml of phleomycin for 6 weeks (6WP) or left untreated (WT, AM). DNA was extracted and DNA methylation was profiled by the Australian Genome Research Facility (AGRF) using the Illumina EPIC 850k array. A) Heatmap of top 50 most differentially methylated CpGs. Red indicates high levels of methylation and blue low methylation relative to the mean for a given CpG. CpGs not associated with a known gene are labelled ‘NA.’ B) Plot of over 1500 CpGs in 22Rv1 prostate cancer cells that displayed a beta change >0.25 after 6 weeks of daily DNA damage with a radiomimetic (1= fully methylated; 0= unmethylated). C) intersection of probes across the treatment groups. D) Beta values for OGDHL gene body methylation in four matched primary prostate and metastatic tumours (probe cg08846770 from EPIC array). Data was analysed via students t-test (ns).
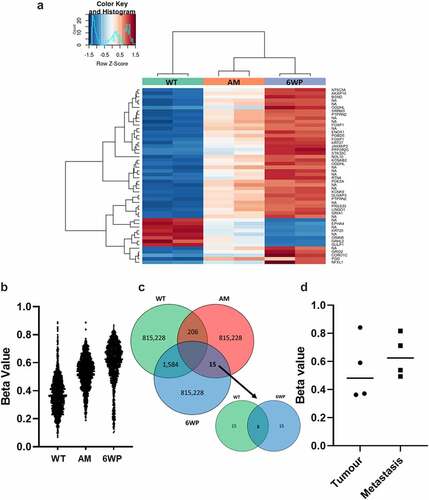
Figure 3. Repeated DNA damage alters transcriptional profile of 22Rv1 cells. 22Rv1 cells were treated daily with 1 μg/ml of phleomycin for 6 weeks (6WP) or left untreated (WT, AM). RNA was extracted and sequenced on the Illumina NovaSeq 6000 platform by the AGRF to generate 100 bp single end reads. A) Heatmap of log count per million (logCPM) values for the top 50 differentially expressed genes based on adjusted p-values. High gene expression is indicated by red and low expression is indicated by blue. Genes and experimental samples with similar expression patterns are clustered together. B) STRING pathway analysis showing interactions between the top 50 genes. C) The most significant IPA network for differential gene expression. Direct (solid line) and indirect (dashed line) connections between the top 500 differentially expressed genes were formed. Green nodes indicate upregulation and red nodes indicate downregulation of the corresponding gene.
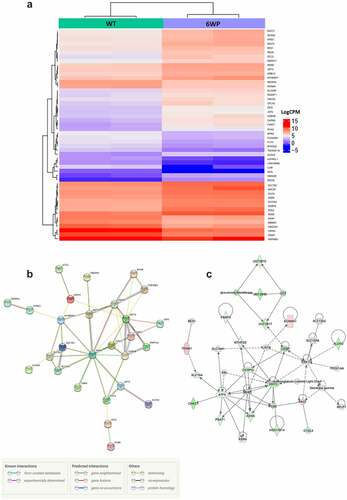
Figure 4. Proteomics analysis of 22Rv1 prostate cancer cells following a single 2 gray dose of radiotherapy. 22Rv1 cells were either left untreated or irradiated with a 2 Gy dose before extracting protein and analysing via HPLC/MS (n = 4). A) Volcano plot representing the fold change of proteins identified by HPLC-MS following irradiation of 22Rv1 cells. The statistical significance of the fold change was assessed using the Student’s t-test. Fold change was plotted against the -log10 P value using Perseus 1.6.15.0. Each point represents a single protein, a red point signifies the protein had significantly increased abundance, while an orange point signifies the inverse. FDR = 0.05, s0 = 0.1. C-T =control-treated. B) Heatmap showing fold change in protein abundance and their relatedness. The log change in protein abundance was calculated and Student t-tests were performed to determine proteins with a significant fold change. The fold change was normalized and plotted on the heatmap using www.heatmapper.ca. The abundance of each protein is indicated by the colour, with low abundance represented in green, and higher abundance in red. C & D) Functional clustering of proteins in irradiated 22Rv1 samples as compared to control. Proteins with a statistically significant fold change were divided into increased or decreased abundance groups. These proteins were submitted separately to DAVID and functional annotation clustering analysis was performed. For each respective set of proteins, the top five clusters by enrichment score are shown above. C) Shows the top five functional clusters by enrichment score as identified in the increased protein abundance group while D) shows the top five functional clusters by enrichment score as identified in the decreased protein abundance group. Additionally, DNA & DSB Repair functional cluster (ranked 7th) was also included as a cluster of interest.
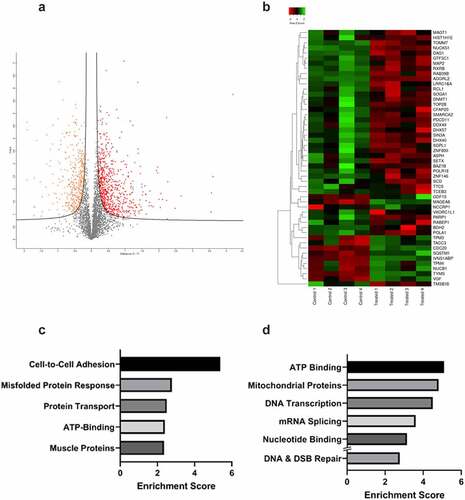
Figure 5. STRING analysis of the top 50 proteins with altered abundance following radiotherapy. Whole cell protein extracts prepared from untreated or irradiated 22Rv1 prostate cancer cells (24 hours following 2 Gy dose). Proteins were analysed via HPLC-MS and the 50 proteins with greatest change in abundance were then analysed via string-db.Org.
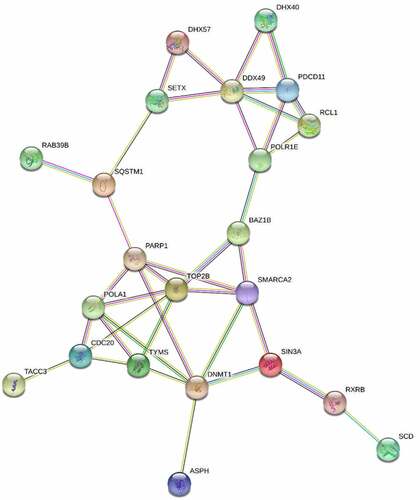
Table 1. Shared transcripts/proteins between RNA-seq and proteomics data sets.
Figure 6. OGHDL and ASNS expression profiling following repeated DNA damage versus a single dose of radiotherapy. 22Rv1 cells were treated daily with 1 μg/ml of phleomycin for 6 weeks (6WP) or left untreated (WT, AM). RNA was extracted and sequenced on the Illumina NovaSeq 6000 platform by the AGRF to generate 100 bp single end reads. RNA-seq reads for A) OGDHL and B) ASNS following repeated DNA damage. Gene expression analysis of C) OGDHL and D) ASNS via RT-qPCR 24 hours following a single dose of 2 Gy RT. The mean and SEM from three biological replicates are shown, p-value determined by students t-test. E) CBioPortal overall survival data for prostate cancer patients with altered ASNS.
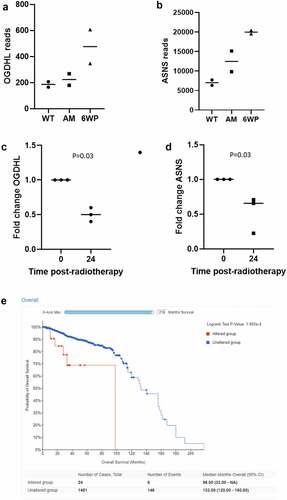
Figure 7. Proposed mechanism of chronic DNA damage on cell metabolism. Repeated DNA damage over time results in depletion of NAD+ due to the action of PARP1. The cell then compensates for this by attempting to increase TCA intermediates. The roles of ASNS and OGDHL are highlighted.
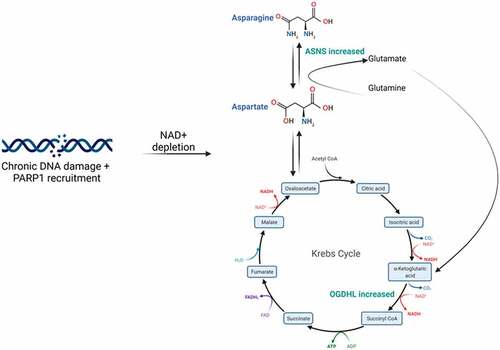
Table 2. Primer sequences for RT-qPCR.