
Figures & data
Table 1. Characteristics of participants in the TruDiagnostic DNA Biobank.
Figure 1. Manhattan plots of the epigenome-wide association study (EWAS) of tobacco (a), alcohol (b), and marijuana (c) consumption. The Y-axis represents the -log10(p) values and the X-axis the position of the CpG sites within the chromosome. The blue line is the suggestive nominal p-value threshold (0.0001) and the red line is the p-value adjusted threshold lower than 0.05.
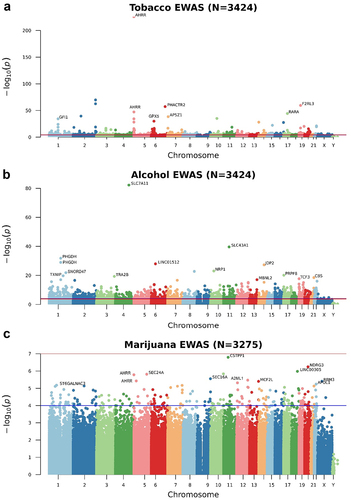
Figure 2. Boxplots showing the association between CpG methylation and substance consumption. (a) Association between cg05575921 methylation (AHRR) and tobacco consumption. (b) Association between cg06690548 methylation (SLC7A11) and alcohol consumption. The Y-axis represents the residuals for beta values after adjusting by covariates. The X-axis represents the number of cigarettes smoked and the frequency of drinking, respectively. Methylation means for each tobacco consumption level are represented with their 95% confidence intervals.
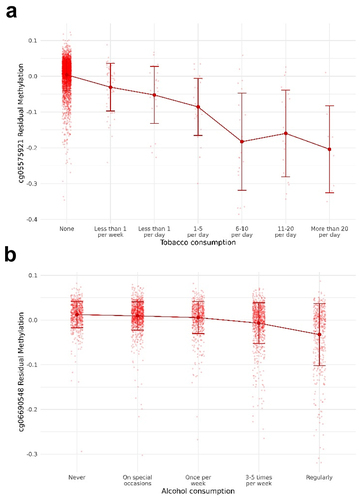
Table 2. Top 15 differentially methylated CpG sites by tobacco consumption.
Table 3. Top 15 differentially methylated CpG sites by alcohol consumption.
Table 4. Top 15 differentially methylated CpG sites by marijuana consumption.
Figure 3. Venn diagrams comparing CpG sites and genes differentially methylated for tobacco and alcohol use. (a) Comparison between differentially methylated CpG sites with a P-value adjusted lower than 0.05. (b) Comparison between genes where the CpG sites differentially methylated are annotated.
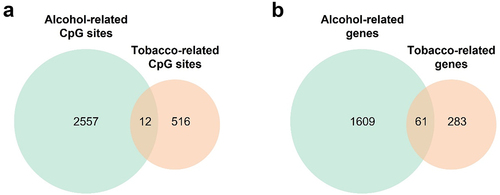
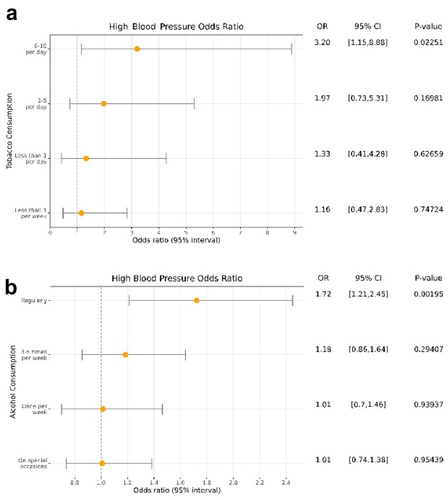
Figure 4. Forest plot of the association between tobacco (a) and alcohol (b) consumption with hypertension. OR: Odds Ratio.
Supplemental Material
Download Zip (1 MB)Data availability statement
The data that support the findings of this study are available upon reasonable request due to ensure the privacy of the participants. Please email [email protected] for data requests. Any custom code or software used in our analysis is available at DOI: 10.5281/zenodo.6417926 (URL: https://zenodo.org/badge/latestdoi/296552532).