
Figures & data
Table 1. Baseline patient characteristics by cardiovascular case status.
Figure 1. Correlation between chronological age and DNA methylation-based biological age according to four established epigenetic clocks in 60 hemodialysis patients; (A) HorvathAge, (B) HannumAge, (C) PhenoAge, and (D) GrimAge.
Figure 2. Violin plots comparing epigenetic age accelerations between cardiovascular cases and controls* according to Horvath-, Hannum-, Pheno-, and GrimAge.
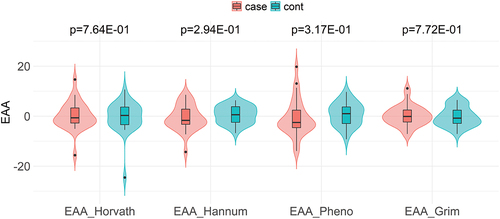
Figure 3. Manhattan plot of the association between DNA methylation and cardiovascular death in 60 hemodialysis patients.
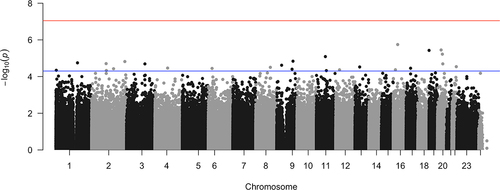
Table 2. Top 10 most significant CpG sites associated with cardiovascular death based on the genome-wide suggestive threshold at p-value of 5.0 × 10⁻⁵.
Supplemental Material
Download MS Word (360.7 KB)Data availability statement
The data used in these analyses were provided by DaVita Clinical Research. Requests for access to data can be made in writing to DaVita Clinical Research.