
Figures & data
Figure 1. Gene expression (∆∆Ct) in three comparisons: inflammation during 1st lactation (L1-I, n = 5; L1-NI, n = 7) (orange), inflammation during 2nd lactation after inflammation in 1st (L2-I (L1-I), n = 7; L2-NI (L1-I), n = 5) (green), and inflammation during 2nd lactation with no prior inflammation (L2-I (L1-NI), n = 5; L2-NI (L1-NI), n = 7) (purple). The genes listed are differentially expressed (p < 0.05) in at least one comparison (colour-coded circles). Each column represents one individual. Lowest gene expression is represented in blue (highest ∆∆Ct values), highest – in red (lowest ∆∆Ct values), no data available – in black.
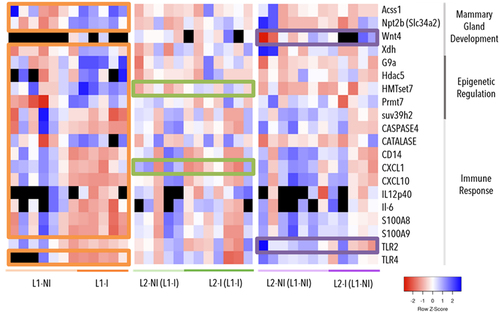
Table 1. Library characterization, mapping efficiency on the murine genome (GRCm38), coverage and average methylation in RRBS libraries.
Figure 2. Hierarchical clustering and principal component analysis of samples from 1st lactation, with (orange) or without inflammation (black).
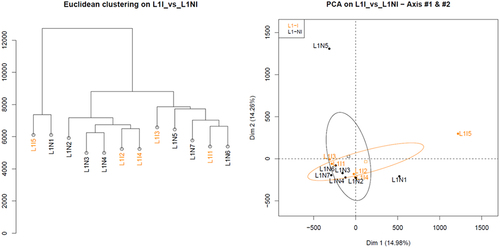
Figure 3. Violin plots of the overall distribution of methylation levels in all three comparisons: inflammation during 1st lactation (L1-I, n = 5; L1-NI, n = 7) (orange), inflammation during 2nd lactation after inflammation in 1st (L2-I (L1-I), n = 7; L2-NI (L1-I), n = 5) (green), inflammation during 2nd lactation with no prior inflammation (L2-I (L1-NI), n = 5; L2-NI (L1-NI), n = 7) (purple). The abscissa represents the different conditions in each comparison, the ordinate represents the level of methylation of the DMCs in that condition, and each violin represents the density of the point at that methylation level.
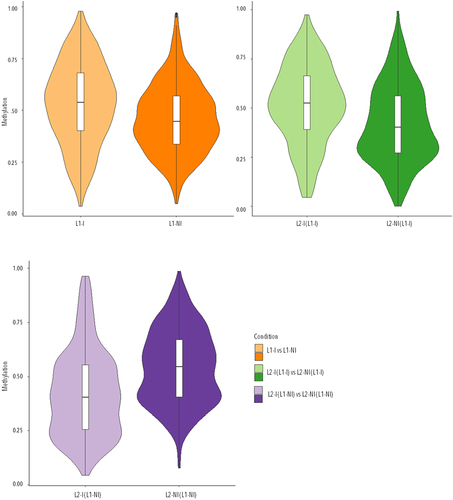
Figure 4. Venn diagrams of the total number of differentially methylated cytosines (DMCs) as well as shared DMCs in all three comparisons: inflammation during 1st lactation (L1-I, n = 5; L1-NI, n = 7) (orange), inflammation during 2nd lactation after inflammation in 1st (L2-I (L1-I), n = 7; L2-NI (L1-I), n = 5) (green), inflammation during 2nd lactation with no prior inflammation (L2-I (L1-NI), n = 5; L2-NI (L1-NI), n = 7) (purple) (A) and of the total number of differentially methylated regions (DMRs) as well as shared DMRs in all three comparisons (B).
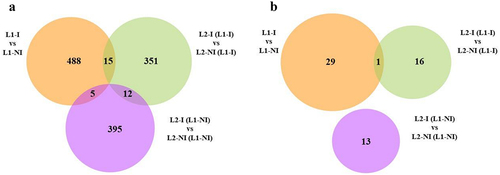
Figure 5. Pie charts showing the distribution of DMCs for all three comparisons: inflammation during 1st lactation (L1-I, n = 5; L1-NI, n = 7) (orange), inflammation during 2nd lactation after inflammation in 1st (L2-I (L1-I), n = 7; L2-NI (L1-I), n = 5) (green), inflammation during 2nd lactation with no prior inflammation (L2-I (L1-NI), n = 5; L2-NI (L1-NI), n = 7) (purple). Distribution is shown according to gene regions (A), CpG density (B), and repeats (C). All three comparisons are discussed in comparison to the background (control comprised of all CpGs found after RRBS analysis).
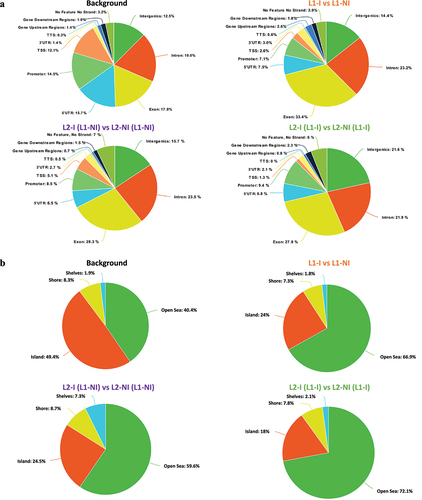
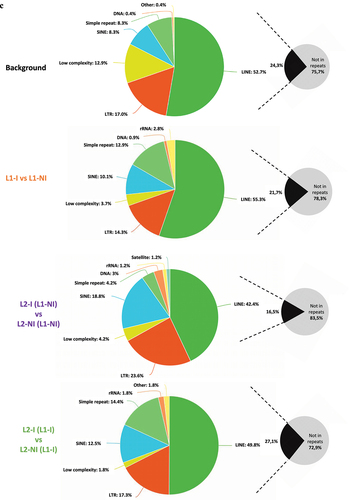
Table 2. GO (gene ontology) terms (MF: molecular function; BP: biological process) and signalling pathways enriched by DAVID analysis for all three comparisons: inflammation during 1st lactation (L1-I, n = 5; L1-NI, n = 7) (orange), inflammation during second lactation after inflammation in 1st (L2-I (L1-I), n = 7; L2-NI (L1-I), n = 5) (green), inflammation during second lactation with no prior inflammation (L2-I (L1-NI), n = 5; L2-NI (L1-NI), n = 7) (purple).
Supplemental Material
Download Zip (5.9 MB)Data availability statement
RRBS fastq files have been deposited in the European Nucleotide Archive (ENA) at EMBL-EBI under accession number PRJEB57878 https://www.ebi.ac.uk/ena/data/view/PRJEB57878.