
Figures & data
Figure 1. Sample selection diagram. Data are from the health and retirement study. VBS = Venous blood study.
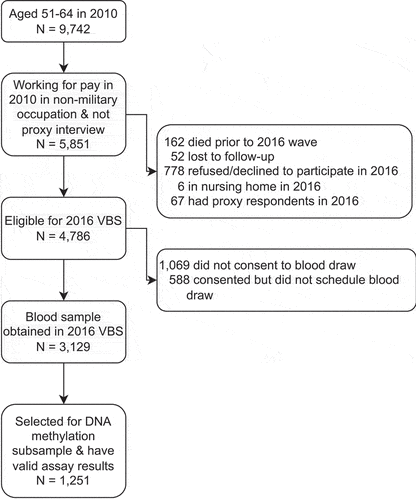
Table 1. Summary statistics of analytic sample: percent or mean (SD).
Figure 2. Associations between current occupation category in 2010 and epigenetic age measures in 2016. The displayed effect sizes are the coefficients from linear regressions along with the 95% confidence intervals around these coefficients. The reference occupational category is managerial/professional and the coefficients for the other categories indicate the estimated difference in the epigenetic age measure between that category and managerial/professional after accounting for the other included covariates. Model 1 adjusts for age and sex. Model 2 additionally includes race/ethnicity and educational attainment. Model 3 additionally includes smoking status, alcohol consumption, physical inactivity, and Body Mass Index (BMI) category.
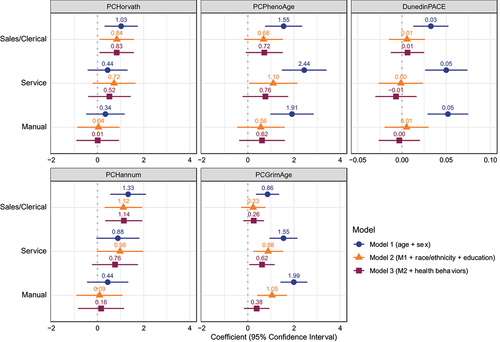
Figure 3. Associations between self-reported working conditions in 2010 and epigenetic age measures in 2016. The displayed effect sizes are the coefficients from linear regressions along with the 95% confidence intervals around these coefficients. These self-reported working conditions are all binary measures and the coefficients refer to the estimated difference in a measure between individuals with and without this occupational characteristic after accounting for the other included covariates. Model 1 adjusts for age and sex. Model 2 additionally includes race/ethnicity and educational attainment. Model 3 additionally includes smoking status, alcohol consumption, physical inactivity, and Body Mass Index (BMI) category.
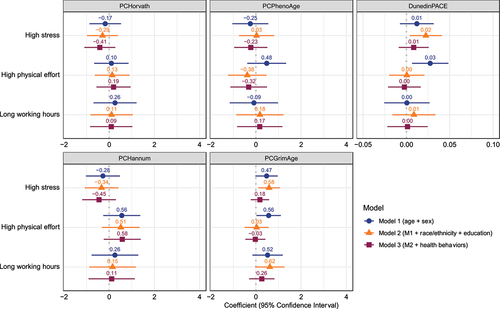
Figure 4. Joint association between current occupation category and self-reported working conditions in 2010 and epigenetic age measures in 2016. The displayed effect sizes are the coefficients from linear regressions along with the 95% confidence intervals around these coefficients. The reference occupational category is managerial/professional and the coefficients for the other categories indicate the estimated difference in the epigenetic age measure between that category and managerial/professional after accounting for the other included covariates. Model 1 adjusts for age and sex. Model 2 additionally includes race/ethnicity and educational attainment. Model 3 additionally includes smoking status, alcohol consumption, physical inactivity, and Body Mass Index (BMI) category.
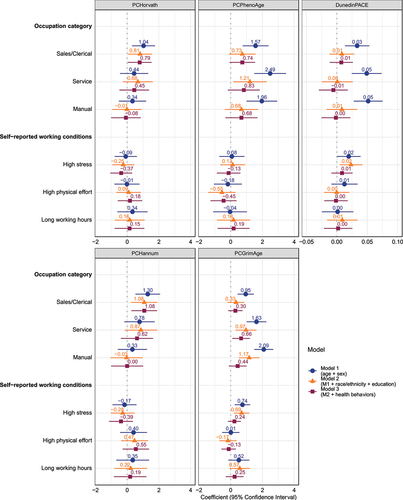
Table A1. Associations between occupational category and epigenetic age measures.
Table A2. Associations between self-reported working conditions and epigenetic age measures.
Table A3. Joint association between current occupation category and self-reported working conditions in 2010 and epigenetic age measures.
Table B1. Summary statistics of longest-reported occupational category in analytic sample.
Table B2. Current occupational category by longest-reported occupational category.
Table B3. Associations between longest-reported occupational category and epigenetic age measures.
Table C1. Summary of job demands and job control questionnaire items.
Table C2. Associations between self-reported working conditions and epigenetic age measures in subsample that responded to psychosocial leave-behind questionnaire: High job strain as measure of job stress.
Supplemental Material
Download MS Word (47.6 KB)Data availability statement
The data that support the findings of this study are available from the Health and Retirement Study (HRS). These data are available to registered users who meet security requirements and agree to data use conditions specified by the HRS at https://hrsdata.isr.umich.edu/data-products/conditions-of-use