
Figures & data
Table 1. Future of Families and Child Wellbeing Study sample characteristics at age 9, by sex (N = 796).
Figure 1. characteristics of differentially methylated sites in the Future of Families and Child Wellbeing Study sample, age 9 (N = 796). a: Adjusted difference in autosomal DNA methylation between female and male children for each site (n = 391,980 sites) in the Fragile Families and Child Wellbeing Study sample, age 9 (N = 796). Effect sizes and -log10 p-values are from the main model containing fixed effects for sex, epithelial cell proportion, and mother’s race/ethnicity and a random effect for sample plate. Positive effect sizes indicate sites for which DNA methylation was higher in female children, while negative effect sizes represent sites for which DNA methylation was higher in male children at age 9. 8,430 sites achieved genome-wide significance at P = 2.4× 10⁻⁷ (horizontal dotted line), with n = 6,425 (76.2%) having higher methylation in female participants. b: Distributions of mean DNAM for differentially methylated sites (n = 8,430; dashed line) and remaining sites (n = 383,550). c: Distribution of differentially methylated sites in relation to CpG islands. Fragile Families and Child Wellbeing Study sample, age 9 (N = 796).
Figure 2. comparison of adjusted sex differences in autosomal DNA methylation between ages 9 and 15 in the Future of Families and Child Wellbeing Study (N = 796, n = 390,659 sites). a: Correlation of adjusted difference in autosomal DNA methylation (%) by sex between ages 9 and 15 in the Future of Families and Child Wellbeing Study (n = 390,659 sites). Effect sizes at each time point are from the main model adjusting for sex, epithelial cell proportion, mother’s race/ethnicity at baseline and a random effect for plate. Positive percentages are sites for which female children had higher DNA methylation than males. Spearman’s correlation = 0.53. b: Miami plot of sex-specific DNAm analyses at ages 9 and 15 in the Future of Families and Child Wellbeing Study sample (N = 796). P-values are reported from the main model containing sex, epithelial cell proportion, maternal race/ethnicity at baseline, and a random effect for sample plate. A threshold of P = 2.4 × 10⁻⁷ is used for genome-wide significance.
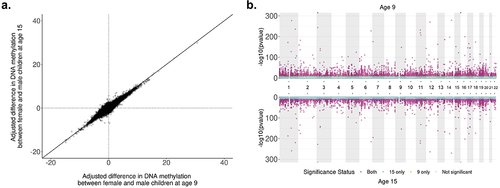
Figure 3. comparison of adjusted differences in DNA methylation between saliva tissue from the Future of Families cohort and cord blood tissue from Solomon et al., 2022 (Spearman correlation = 0.89).
Supplemental Material
Download Zip (124.9 MB)Data availability statement
The data that support the findings of this study are available on request from the co-authors [DN, CM]. The data are not publicly available due to restrictions; however, data will be released in 2023 per the NIH data guidelines. Survey data for the Future of Families and Child Wellbeing study can be accessed at https://ffcws.princeton.edu/.