
Figures & data
Table 1. Descriptive statistics of newborns and mothers included in the study.
Figure 1. Manhattan plots of eight epigenome-wide association tests of maternal stress measures among mothers (a–d) and newborns (e–h). Dashed lines indicate the Bonferroni level of significance (p = 7.07 × 10⁻⁸ for mothers and 7.23 × 10⁻⁸ for newborns). A total of 706,981 probes for mothers and 691,867 for newborns were included in analyses. N = 145.
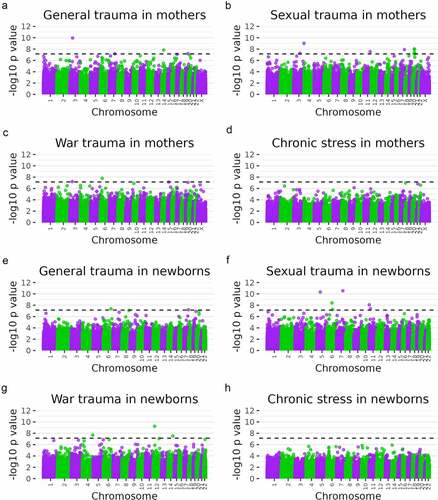
Table 2. Bonferroni-corrected differentially methylated positions in EWAS in mothers and newborns.
Figure 2. Epigenetic age acceleration and maternal stress measures in mothers and newborns. Colors correspond to the unstandardized beta coefficient of a regression of epigenetic age acceleration measures on maternal stress measures. N = 149 for mothers and N = 145 for newborns.
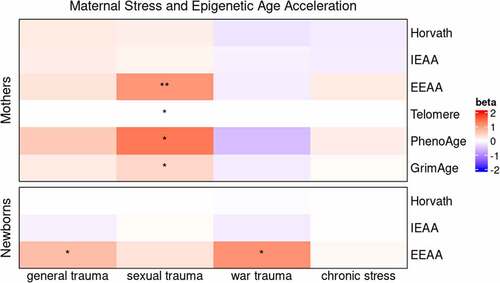
Figure 3. Maternal stress and epigenetic age acceleration in mothers (a–d) and newborns (e–f). Darker colour corresponds to greater biological ageing. Sample sizes were N = 149 for mothers and N = 145 for newborns.
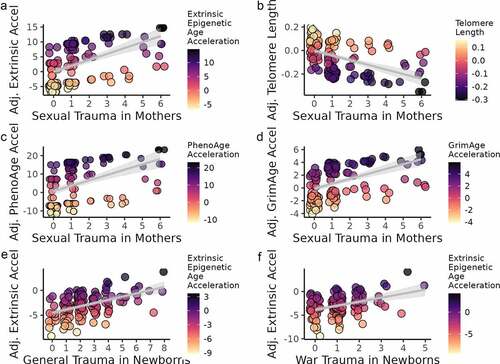
Figure 4. eFORGE analysis for enrichment of DNase I hypersensitive sites in newborns. Analyses were performed with the top 125 differentially methylated, hyper-methylated, and hypo-methylated CpG sites for the three maternal stress measures with Bonferroni-corrected significant sites in the EWAS. The top 125 DMPs were compared to the EPIC array distribution of probes to test whether the top 125 DMPs were significantly associated with DNase I hypersensitive locations in genome.
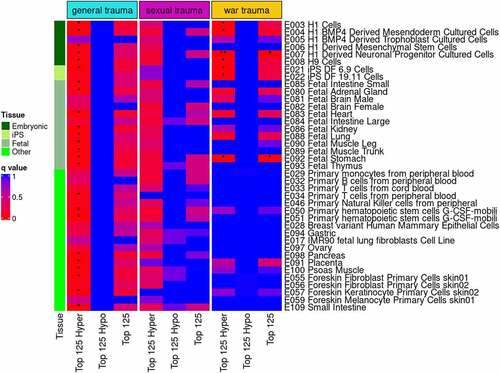
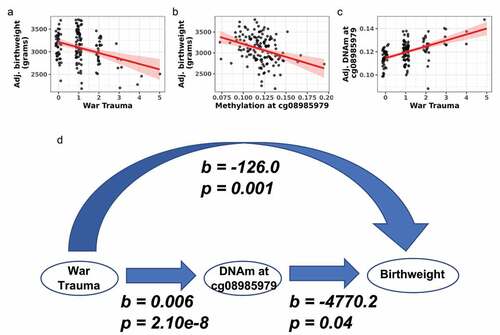
Figure 5. War trauma was associated with DNA methylation and birthweight in newborns. (a) War trauma was negatively associated with birthweight. (b) DNA methylation at cg08985979 was negatively associated with birthweight. (c) War trauma was positively associated with DNA methylation at cg08985979 in an EWAS. (d) Model linking war trauma with DNA methylation and birthweight.
Supplemental Material
Download MS Word (26 KB)Data availability statement
DNA methylation data are available at gene expression omnibus under record GSE224365. R scripts are available at github.com/edward-quinn/congo_ewas.