Figures & data
Figure 1. The levels of NEAT1 and IL-6 are elevated in SLE patients compared with HCs. (A) The comparison of secreted levels of IL-6 in plasma between SLE patients and HCs (15 vs 15). (B) The comparison of secreted levels of IL-6 in the moDCs cell supernatants between SLE patients and HCs (6 vs 6). (C) The comparison of the expression level of NEAT1 between SLE patients and HCs (15 vs 15). (D) The correlation between the expression level of NEAT1 and SLEDAI scores of SLE patients. HC, healthy controls; moDCs, monocyte-derived dendritic cells; SLE: systemic lupus erythematosus; NEAT1, nuclear paraspeckle assembly transcript 1; SLEDAI: systemic lupus erythematosus disease activity index. P values for two parametric sample comparisons were determined by unpaired t-test and the Pearson correlation coefficient was calculated.
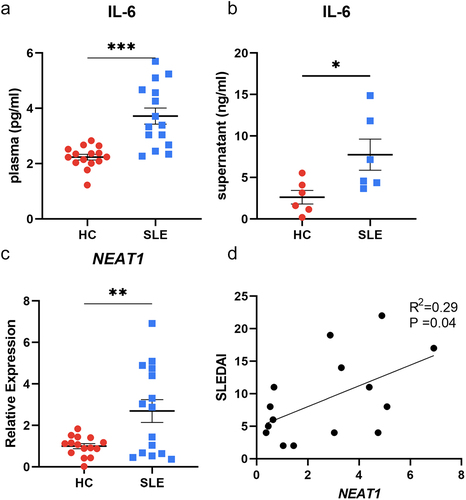
Table 1. Clinical characteristics of included SLE patients.
Figure 2. NEAT1 is closely associated with the inflammatory functions of moDcs. (A) The change in the expression level of NEAT1 when the stimulator LPS was added for 24 hours. (B-C) Expression levels of mRNA IL6 in moDCs when NEAT1 was overexpressed (adeno-V vs adeno-OE) and knocked down (NC vs SS-NEAT1). (D) Expressions of surface markers including CD86, CD40, and HLA-DR in the NEAT1 overexpression group (red) compared with negative controls (blue). (E-F) The secretion of IL-6 in the supernatant of moDCs when NEAT1 was up-regulated (adeno-V vs adeno-OE) and downregulated (NC vs SS-NEAT1). Data were shown as mean±SEM. moDCs, monocyte-derived dendritic cells; NC, negative control; NEAT1, nuclear paraspeckle assembly transcript 1; SS, smart silencer; adeno, adenovirus; OE, overexpression. P values for two parametric sample comparisons were determined by unpaired t-test.
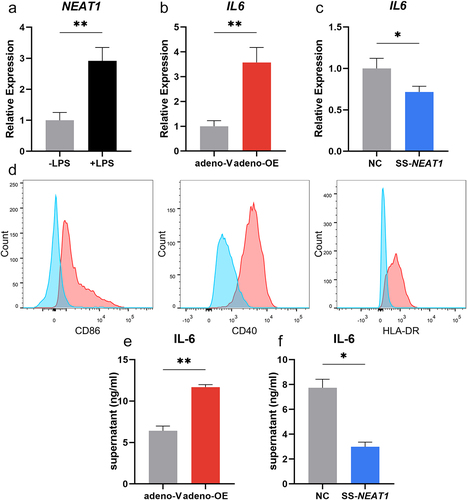
Figure 3. Mir-365a-3p could reduce IL-6 secretion in moDcs. (A) Expression levels of miR-365a-3p in moDCs of SLE patients compared with those of HCs (6 vs 6). (B-C) Adenovirus containing miR-365a-3p mimics and inhibitor were transfected into moDCs and the mRNA levels of IL6 changed as miR-365a-3p was artificially modulated. (D-E) The levels of miR-365a-3p were validated by qRT-PCR when NEAT1 was knocked down and up-regulated. moDCs, monocyte-derived dendritic cells; NC, negative control; NEAT1, nuclear paraspeckle assembly transcript 1; SS, smart silencer; adeno, adenovirus. P values for two sample comparisons were determined by unpaired t-test or Mann–Whitney test.
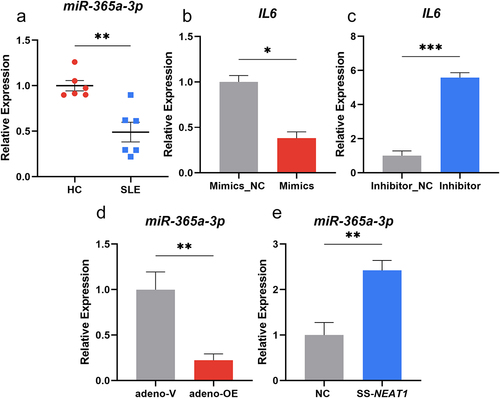
Figure 4. NEAT1 can act as the competing endogenous RNA for miR-365a-3p and IL6. (A, C) pSI-Check2 plasmids carrying predicted binding sites of NEAT1 and IL6 with miR-365a-3p and corresponding mutants were constructed. Dual luciferase reporter assays were performed. (B, D) MiR-365a-3p mimics and negative controls were added separately to interact with wildtype and mutant sequences of NEAT1 and 3’UTR of IL6. NC, negative control; NEAT1, nuclear paraspeckle assembly transcript 1; wt, wildtype; mut, mutant; miR, microRNA, ns, not significant. P values for two parametric sample comparisons were determined by unpaired t-test.
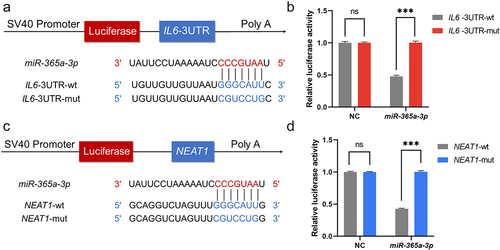
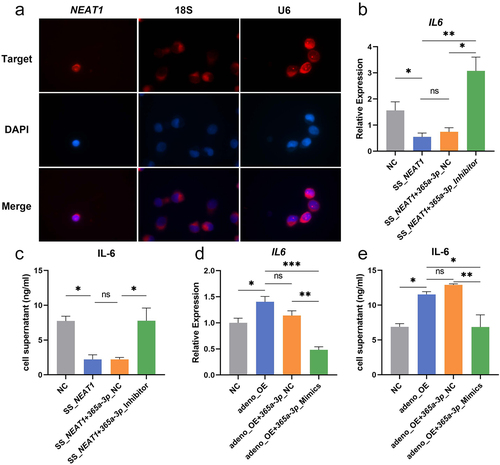
Figure 5. NEAT1 restores the IL-6 secretion by targeting miR-365a-3p. (A) Intracellular colocalization of NEAT1 in moDCs was ascertained using RNA FISH. 18s and U6 were the controls for the cytoplasm and nucleus. (B-E) The secretion and mRNA levels of IL-6 were further evaluated by ELISA and qRT-PCR in rescue validations when NEAT1 and miR-365a-3p were regulated at the same time. Data were shown as mean±SEM. FISH, Fluorescence in situ hybridization; NC, negative control; NEAT1, nuclear paraspeckle assembly transcript 1; SS, smart silencer; adeno, adenovirus; OE, overexpression; ns, not significant. The parametric one-way ANOVA test or nonparametric Kruskal–Wallis test were applied for the multiple sample comparisons.