
Figures & data
Figure 1. a) a sliding window of 150 bp was applied across the entire 45S rDNA locus where the coefficient of variation (CV) for the depth coverages of all libraries was calculated. The x-axis represents the 28S rDNA coordinates while the CV in depth coverages of WGS brain (red), WGBS Neuron (green) and WGBS Olig2 (blue) is plotted on the Y-axes. The highlighted grey area represents the selected window with minimum CV for 28S rDNA copy number calculation. b) WGS bulk tissue vs WGBS Neuronal libraries for 18S and 28S relative rDNA CN. WGS bulk tissue vs WGBS Oligodendrocyte libraries for c) 18S and 28S relative rDNA CN.
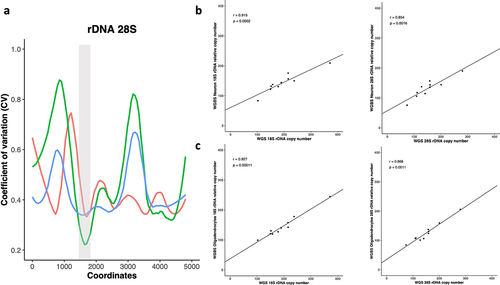
Figure 2. Relative rDNA copy number and global rDNA methylation in multiple post-mortem tissues from each of three individuals.
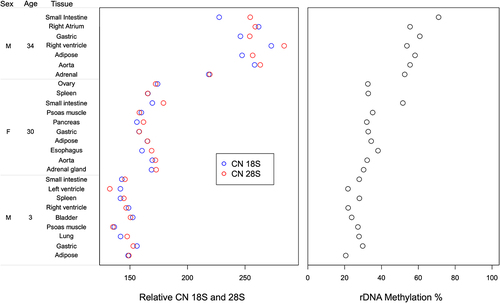
Figure 3. a) Relative 18S and 28S rDNA copy number in ASD vs control brains (16 ASD vs 11 control). No significant difference was observed after adjusting for age and gender. b) Relationship between 18S relative rDNA copy number and DNA methylation at the 45S rDNA locus: 18S rDNA CN was significantly associated with average methylation at the 45S rDNA locus after adjusting for age, gender and disease status. Each dot represents a 200 bp bin whose average DNA methylation was calculated. The obtained p-values were FDR adjusted prior to plotting. The values above the dotted line (red dots) indicate a significant association (p < 0.05) while the values below the dotted line (blue) indicate non-significant differences. The x axis represents the 45S rDNA coordinates. c) Scatter plot showing the relationship between relative 18S rDNA copy number and DNA methylation across rDNA coordinates 7400–7599.
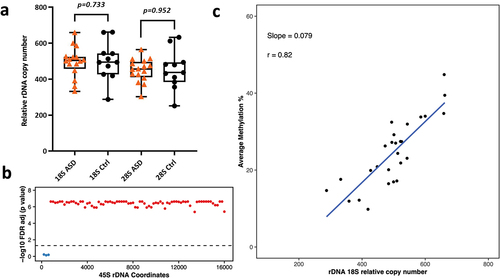
Figure 4. Relative rDNA copy number in a) Schizophrenia (SCZ) neurons vs controls. No significant difference was observed after adjusting for both age and gender. b) Relationship between 18S relative rDNA copy number and DNA methylation at the 45S rDNA locus after adjusting for the following: age, gender and disease status. Each 200 bp bin is displayed as a dot and the average DNA methylation of all CpG sites in the bin was calculated. The obtained p-values were FDR adjusted. The values above the dotted line (red dots) indicate a significant association (p < 0.05) while the values below the dotted line (blue) indicate no significant difference. c) Scatter plot for relative 18S rDNA copy number vs DNA methylation across rDNA coordinates 7400–7599 in neurons.
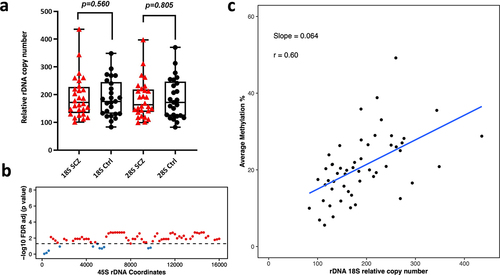
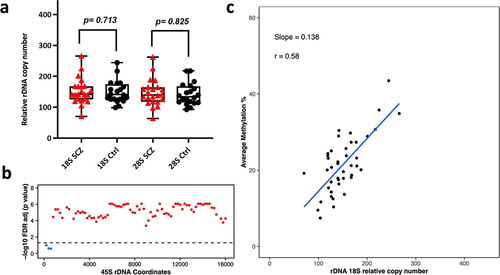
Figure 5. Relative rDNA copy number in a) Schizophrenia (SCZ) oligodendrocytes vs controls. No significant difference was observed after adjusting for age and gender. b) Relationship between 18S relative rDNA copy number and DNA methylation at the 45S rDNA locus in oligodendrocytes after adjusting for age, gender and disease status. Each dot represents a 200 bp bin whose average DNA methylation was calculated. The obtained p-values were FDR adjusted and plotted. The values above the dotted line (red dots) indicate a significant association (p < 0.05) while the values below the dotted line (blue) show non-significant differences. The x-axis indicates the 45S rDNA coordinates. c) 18S rDNA copy number vs DNA methylation across rDNA coordinates 7400–7599 in oligodendrocytes.
Supplemental Material
Download Zip (821.9 KB)Data availability statement
The datasets used and analysed in this study are publicly available under the following BioProject accession numbers: ASD dataset: PRJNA321909 (GSE81541- https://www.ncbi.nlm.nih.gov/bioproject/PRJNA321909) and PRJNA490887 (GSE119981- https://www.ncbi.nlm.nih.gov/bioproject/490887); Schizophrenia dataset: PRJNA421218 (https://www.ncbi.nlm.nih.gov/bioproject/PRJNA421218) and PRJNA422380 (https://www.ncbi.nlm.nih.gov/bioproject/PRJNA422380); and the multi-tissue dataset: PRJNA34535 (https://www.ncbi.nlm.nih.gov/bioproject/PRJNA34535).