
Figures & data
Table 1. Primer sequences for RT-Qpcr and MeRIP-Qpcr..
Table 2. Sequence statistics and quality control.
Figure 1. Peak Distribution. (a) m6A peaks distributions in black and white skin of sheep among mRNA transcripts. (b) m6A peaks distributions in black and white skin of sheep among genes. (c) Distributions of differential m6A peaks in per gene. (d) Numbers of m6A peaks in the mRNA transcripts of chromosomes in black skin of sheep. (e) Numbers of m6A peaks in the mRNA transcripts of chromosomes in white skin of sheep. (f) the top five motif sequences for m6A-containing peaks from all samples.
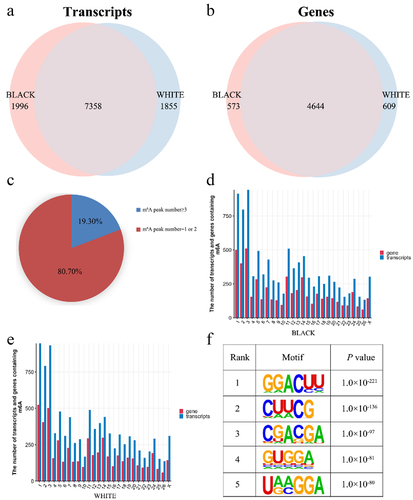
Figure 2. Peak Distribution. (a) Density distributions of m6A peaks in different gene functional elements (5'UTR, CDS, and 3'UTR) in each sample. (b) Distributions of m6A peaks in different gene functional elements (5'UTR, 3'UTR, 1 st exon, and other exons) in black skin and white skin.
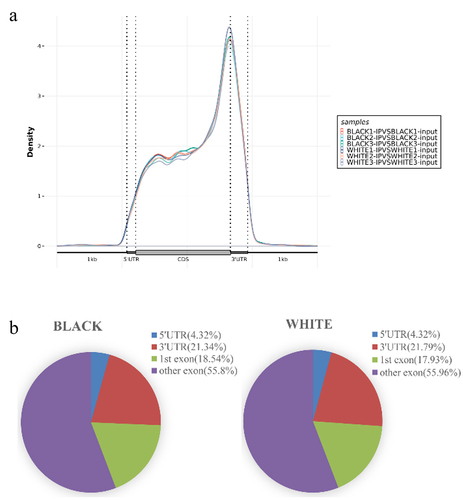
Figure 3. m6A peaks in black skin and white skin of sheep. (a) Significantly different m6A peaks in black skin vs. white skin. (b) Significant differences in the distributions of m6A peaks on sheep chromosomes.
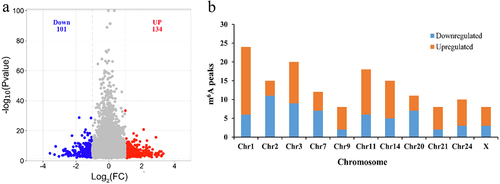
Table 3. Top 10 significantly upregulated and downregulated m6A peaks (BLACK vs. WHITE).
Figure 4. GO analyses of m6A modified genes. Top 15 GO terms of the differentially methylated downregulated genes and upregulated genes in three categories (BP, MF, CC). The red column indicates significant enrichment, while the blue column indicates insignificant enrichment.
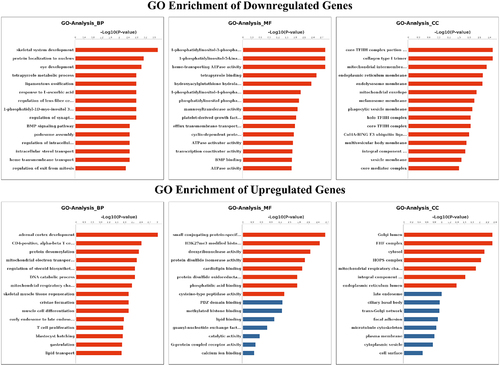
Figure 5. KEGG analyses of m6A modified genes. The enriched KEGG pathways of the differentially methylated downregulated genes (a) and upregulated genes (b).
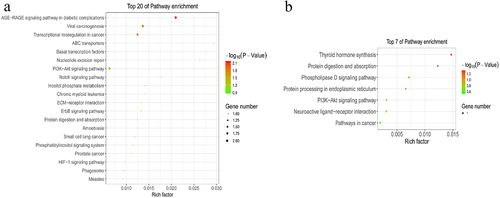
Figure 6. GO and KEGG analyses of DEGs. (a) Volcano plot showing the differential gene expression in black skin vs. white skin of sheep. (b) Top 20 KEGG pathways enriched for DEGs. (c) Top 15 GO terms of DEGs in three categories (BP, MF, CC). The red column indicates significant enrichment, while the blue column indicates insignificant enrichment.
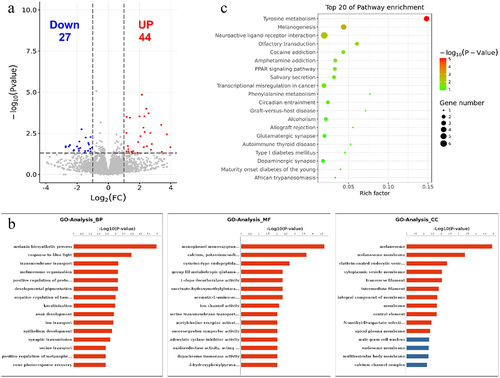
Table 4. Top 10 significantly upregulated and downregulated genes (BLACK vs. WHITE).
Figure 7. Combined m6A-seq and RNA-seq analysis. (a) the overlap gene between downregulated m6A methylation and downregulated mRNA in black skin vs. white skin (b) Four-quadrant diagram depicting the distributions of m6A modified genes and DEGs. (c-d) the enriched KEGG pathways among the identified (c) hyper-up genes and (d) hypo-up genes.
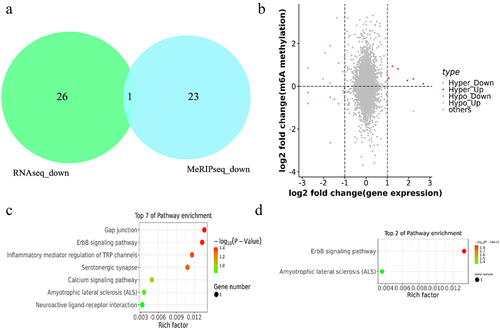
Figure 8. Verification of DEGs and DMGs. (a) the m6A methylation modifications of six genes verified by MeRIP-Qpcr.. (b) the expression levels of six genes verified by qPCR.
Supplemental Material
Download Zip (3.8 MB)Data availability statement
All datasets used in this study are available from the corresponding author on reasonable request.