Figures & data
Figure 1. The epimutacions package workflow. The package accepts GenomicRatioSet object as an input. For the case–control configuration (epimutations function), the case samples and the reference panel are introduced separately. However, for the one-against-others configuration (epimutations_one_leave_out function), all samples are introduced together. The six outlier detection methods can be used with the two configurations. manova, iForest, mlm and mahdist identify differentially methylated regions using bumphunter and then test the outliers’ significance, while quantile and beta define outlier CpGs and then group them into epimutations.
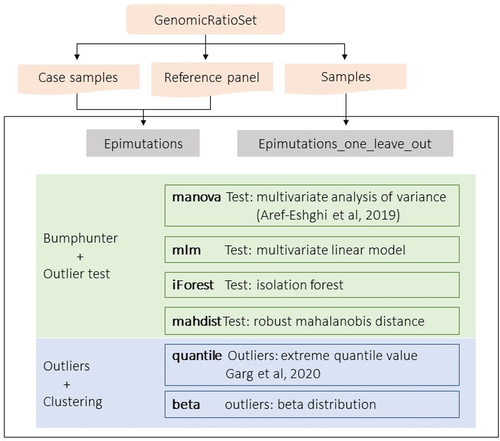
Figure 2. Pediatric cohorts used in the study. Numbers refer to the number of individuals, while numbers in parentheses refer to the number of samples. a: Samples used to evaluate the effect of pre-processing on epimutations detection. All samples are part of the same cohort (cord blood samples of INMA) but were processed in two projects: Lab 1 and Lab 2. Lab 1 was used to define the reference panel, so we called it reference batch, while we defined Lab 2 as alternative batch. Colors define the use of samples in the epimutations analysis: samples used as reference (yellow), technical replicates from the same batch (blue) and technical replicates from different batches (red). Samples from Lab 2 without replicates in Lab 1 (green) were not used in these analyses. b: Samples used to define features of epimutations in a healthy pediatric cohort. At 0 and 4 years old, all samples come from INMA project. At 8 years old, HELIX project contains samples from INMA and four additional cohorts (BIB, EDEN, KANC and RHEA). Samples from INMA project were obtained at three time points (0, 4 and 8 years old). Colors defines the cohort of the samples. INMA individuals present in the three time-points are shown in red, while the rest of INMA samples are shown in blue.
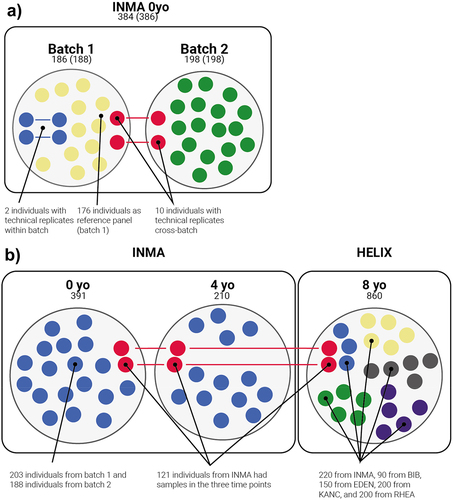
Figure 3. Evaluation of method to detect epimutations. We ran the methods of epimutacions and ramr packages in GSE84727 dataset. We compared the overlap epimutations per method and the identified epimutations per individual. a: Sensitivity of epimutacions methods. Each column contains the proportion of individuals in GSE84727 with a given number of epimutations detected. b: Overlap of the epimutations detected by the different epimutacions methods. c: Sensitivity of rmar methods, compared with beta, mlm, and quantile. These three epimutacions methods were selected because they represented three different sensitivity levels. d: Overlap of the epimutations detected by the rmar methods, beta, mlm, and quantile.
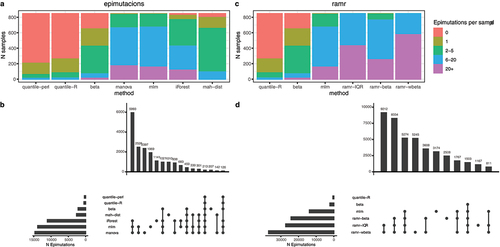
Figure 4. Replicability of epimutations in technical replicates. a: Replicability of epimutations in technical replicates from the same batch. Both replicates: epimutations detected in both replicates. One replicate and outlier signal: epimutations detected in one replicate, while in the other replicates these CpGs are in the most extreme 5%. b: Replicability of epimutations in technical replicates processed in different batches. Each point correspond to a combination of individual, epimutations’ method and preprocessing (raw or residuals). Y-axis represents, for each individual, the proportion of epimutations detected under each replicability state. Both replicates: epimutations detected in both replicates (violet). One replicate and outlier signal: epimutations detected in one replicate, while in the other replicates these CpGs have measurements in the most extreme 5% (purple). Reference: epimutation detected in the replicate from the reference batch and without outlier signal in the replicate from the alternative batch. Alternative: epimutation detected in the replicate from the alternative batch and without outlier signal in the replicate from the reference batch.
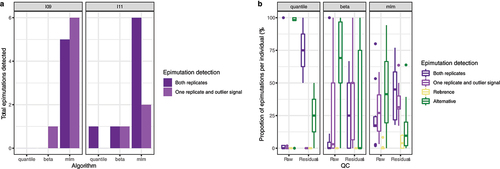
Table 1. Summary of our paediatric cohort.
Figure 5. Epimutations in healthy tissues. a: Epimutations’ burden for a pediatric cohort. Each column contains the proportion of individuals of this cohort with a given number of epimutations detected. Epimutations were detected using quantile, beta and mlm methods. b: Proportion of expression outliers linked to epimutations in the pediatric cohorts. We consider a sample an expression outlier when its expression was lower than Q1–1.5·IQR or higher than Q3 + 1.5·IQR. Three approaches to map epimutations to genes were used: (1) eqtm - use an eQTM catalogue; (2) tss - map an epimutation to a gene when any of the CpGs of the epimutations is mapped to TSS200 or TSS1500 in Illumina annotation; (3) near - map to the gene closest to the epimutation. c: Epimutations replicability in different cell types. Epimutations were grouped depending on the cell type(s) they were detected: CD4 - epimutations only in CD4 (pink), CD8 - epimutations only detected in CD8 (green), monocytes - epimutations only detected in monocytes (blue), 2+ cell types - at least two cell types but not in blood (red), Whole blood - epimutations detected in whole blood but not in the cell types (grey), Whole blood + 1–2 cell types or Whole blood + 3 cell types. Epimutations: epimutations were detected with epimutacions. Epimutations + outliers: epimutations detected in one cell type or whole blood and with outlier values in another cell type or whole blood.
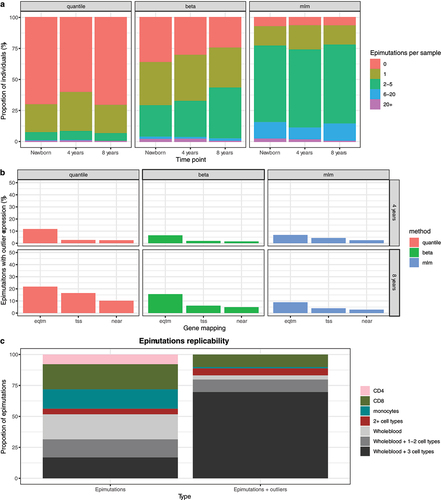
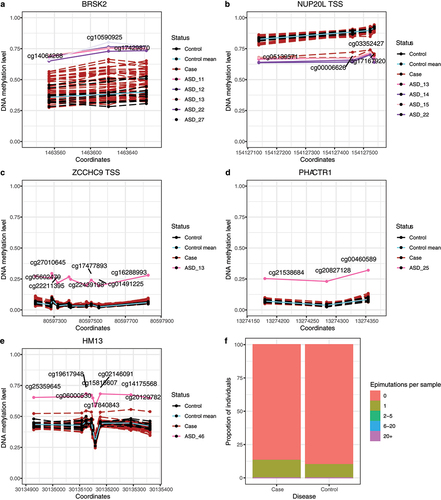
Figure 6. Epimutations in an autism cohort. a-e: Candidate epimutations associated with autism disorder. Mean methylation values for control samples are represented in cyan. Control individuals are colored in black, autism individuals in dark red, and individuals with the epimutation in the other colors. The grey area marks the mean ± 1, 1.5 and 2 SD of the control measurements. a-b: Recurrent epimutations in BRSK2 and NUP20L. c-d: non-recurrent epimutations in ZCCHC9 and PHACTR1. e: epimutation in an imprinted region in HM13 gene. f: Epimutations’ burden in the autism cohort per disease status. Each column contains the proportion of individuals of this cohort with a given number of epimutations detected.