
Figures & data
Figure 1. Description of test-retest scenarios.
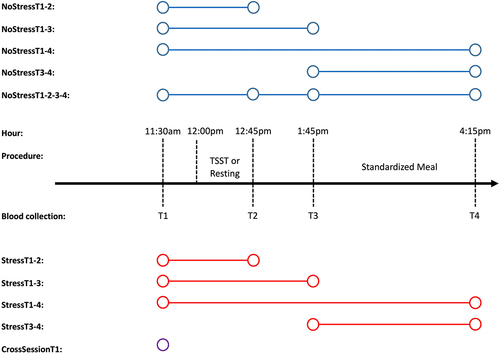
Figure 2. Associations of DNAm probe stability with sample characteristics.
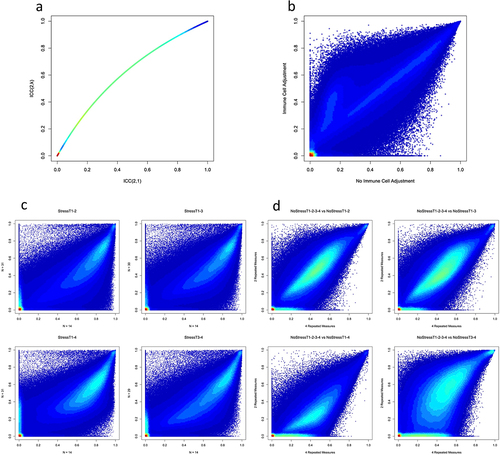
Figure 3. Stability of DNAm probes in test-retest scenarios.
Table 1. Test-retest scenario descriptive statistics.
Table 2. Test-retest scenario probe stability distributions.
Figure 4. DNAm probe set enrichment analyses.
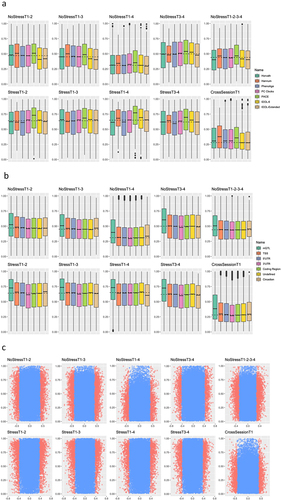
Figure 5. Effects of acute psychosocial stress on highly stable DNAm probes.
Table 3. Effects of acute stress on highly stable DNAm probes.
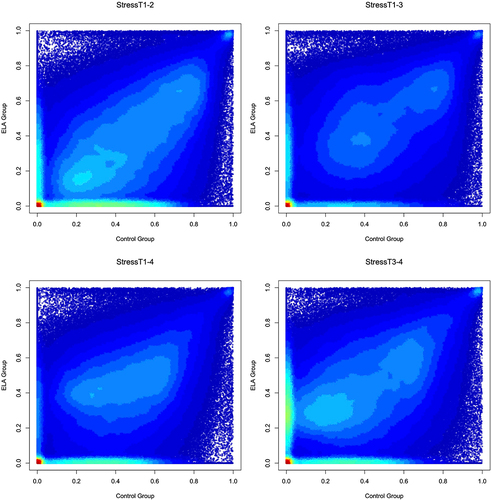
Figure 6. ELA vs. Non-ELA stabilities of DNAm probes in the presence of acute psychosocial stress.
Supplemental Material
Download MS Excel (219.8 KB)Data availability statement
The code used to perform all the analyses is available at: https://github.com/abnerapsley1/DNAmStabilityMeasurements. Data used in this publication have been deposited in NCBI’s Gene Expression Omnibus (GEO) and are accessible through the GEO Series accession number GSE227815 (https://www.ncbi.nlm.nih.gov/geo/query/acc.cgi?acc=GSE227815).