
Figures & data
Figure 1. Overall DNA methylation (DNAme) changes in precancerous and tumour tissues for all five tissue types. a. the distribution of average DNAme levels (aDname) in normal tissues (N), precancerous lesions (P), and cancer samples (C) of five tissue types. The dot colours indicate the data source. ce, cervical; co, colorectal; ga, gastric; pr, prostatic; he, hepatic. * represents for P ≤ 0.05, ** represents for P ≤ 0.01, *** represents for P ≤ 0.001. b. Percentages of hypomethylation (hypo) and hypermethylation DMPs (differentially methylated probes). c. Chromosome enrichment for DMPs of three comparisons.
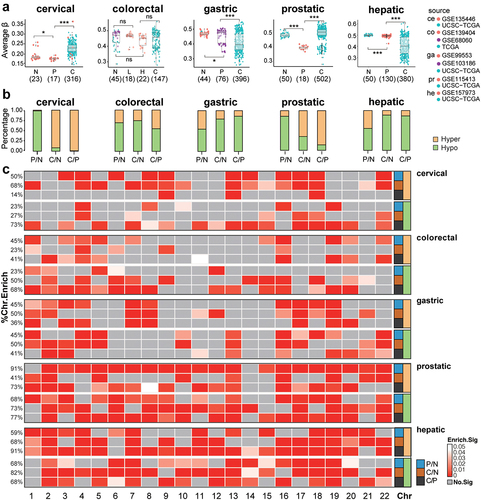
Figure 2. Eight types of methylation alterations across precancerous and tumour stages in all datasets of five tissue origins. a. DNAme fold changes for all eight types. b. Percentages of each type in each tissue origin. c. DNA methylation for DMPs in each sample. Genomic feature enrichment (d) and KEGG and GO enrichment (e) for eight types of DMPs after annotation.
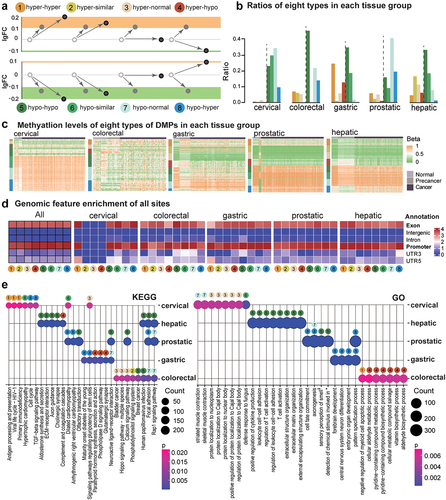
Figure 3. KEGG enrichment for methylation changes across the lesion progression stages.sHyperMethyl includes Types 1 (a) and 2 (b), and sHypomethyl contains Types 5 (c) and 6 (d). The lines indicate common enriched pathways. Red lines: pathways have both hyper and hypo-DNAme alterations enriched in the same tissue; grey lines: pathways harbour different types of DNAme changes in different tissues; blue lines: pathways have the same type of DNAme changes enriched in different tissues.
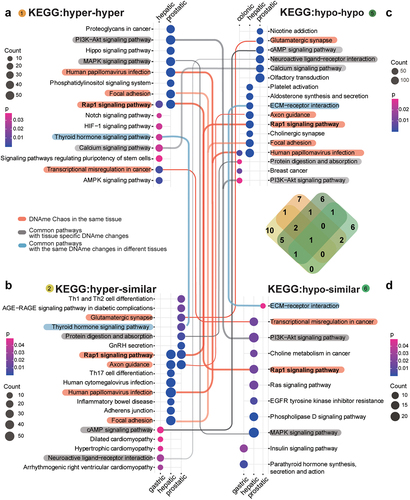
Figure 4. GO enrichment for methylation changes across the lesion progression stages. sHyperMethyl includes Types 1 (a) and 2 (b), and sHypomethyl contains Types 5 (c) and 6 (d). The pathways in red indicate common enriched pathways. Pathways in red have both hyper and hypo-DNAme alterations enriched in the same tissue; pathways in grey harbour different types of DNAme changes in different tissues; pathways in blue have the same type of DNAme changes enriched in different tissues; pathways in green have both types of either sHypermethyl or sHypomethyl enriched in the same tissue.
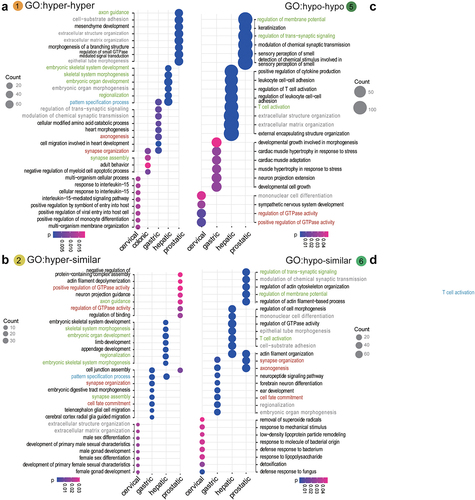
Figure 5. Survival prediction of DMPs across the precancerous state to the tumour.(a).Percentages of sites that had survival prediction ability in eight types of DMPs.(b).Percentages of sites that had survival prediction ability among common DMPs observed in more than two tissue types. (c). KEGG enrichment for the top 1000 sites demonstrates the most significant methylation alterations among different stages. (d). GO enrichment for common sites with survival prediction significance.
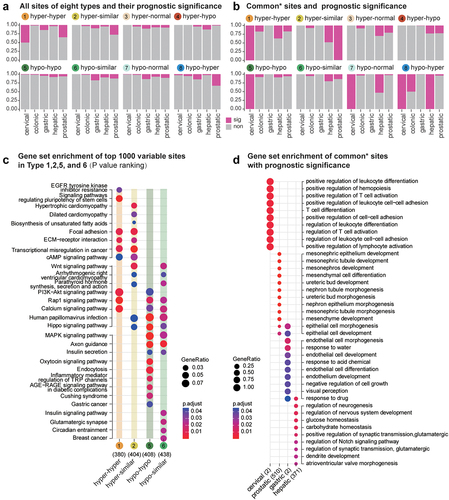
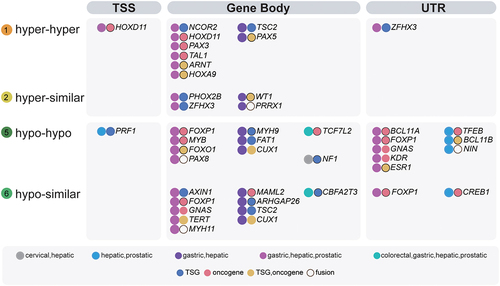
Figure 6. Distribution ofsHyperMethyl or sHypomethyl loci in gene models of TSGs and oncogenes.The three regions of TSS, Gene Body, and UTR were analysed.
Supplemental Material
Download Zip (4.8 MB)Data availability statement
All data used in this study are available in the UCSC Xena website (https://xenabrowser.net/datapages/) and GEO (https://www.ncbi.nlm.nih.gov/geo/) with accession numbers of GSE13544, GSE135446, GSE68060, GSE139404, GSE99553, GSE103186, GSE115413, GSE157973. All the DMPs in five datasets are available at https://github.com/HaikunZhang1/PreCan.