Figures & data
Figure 1. Expression of DNMT1 in melanoma. a: Screening of differentially expressed genes in human melanoma and normal skin tissue samples in melanoma-related microarray dataset GSE3189; b: RT-qPCR measurement of DNMT1 mRNA expression in three melanoma cell lines (A375, SK-MEL-1 and SK-MEL-28) and two human normal melanocytes (PIG1 and HEMn-LP) cell lines; c: Western blot analysis of DNMT1 protein expression in three melanoma cell lines (A375, SK-MEL-1 and SK-MEL-28) and two human normal melanocytes (PIG1 and HEMn-LP) cell lines. Measurement data were characterized as mean ± SD. The comparison between data of two groups was performed by independent sample t test, and that among multiple groups was performed utilizing one-way ANOVA with Tukey’s post-hoc test. All experiments were repeated three times. *p < 0.05 versus the Normal/Control group or HEMn-LP cells.
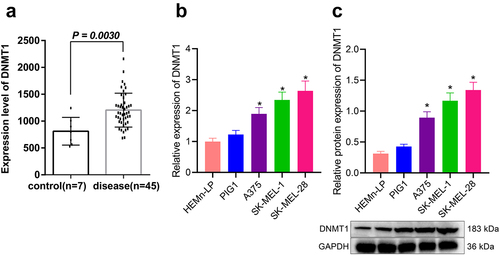
Figure 2. DNMT1 is overexpressed in melanoma and affects the malignant phenotypes of melanoma cells. a: Western blot analysis of DNMT1 protein expression in SK-MEL-28 cells treated with sh-DNMT1, oe-DNMT1, or Decitabine; b: CCK-8 assay to detect SK-MEL-28 cell viability in response to the knockdown/overexpression of DNMT1; c: Transwell assay to detect the migration and invasion of SK-MEL-28 cells in response to the knockdown/overexpression of DNMT1; d: Flow cytometry to detect the apoptosis of SK-MEL-28 cells in response to the knockdown/overexpression of DNMT1; e: Immunofluorescence staining to detect the formation of autophagic flux in SK-MEL-28 cells in response to the knockdown/overexpression of DNMT1 (blue: DAPI; red: HSPB8); f: Western blot measurement of the expression of autophagy-related proteins (Beclin, ATG-3-12 and LC3-II/I) in response to the knockdown/overexpression of DNMT1. Measurement data were characterized as mean ± SD. The comparison between data of two groups was performed by independent sample t test, and that among multiple groups was performed utilizing one-way ANOVA with Tukey’s post-hoc test. Comparison among data at different time points was performed using repeated measures ANOVA with Tukey’s post-hoc test. All experiments were repeated three times. *p < 0.05 versus the sh-NC group. #p < 0.05 versus the oe-NC group. & p < 0.05 versus the DMSO group.
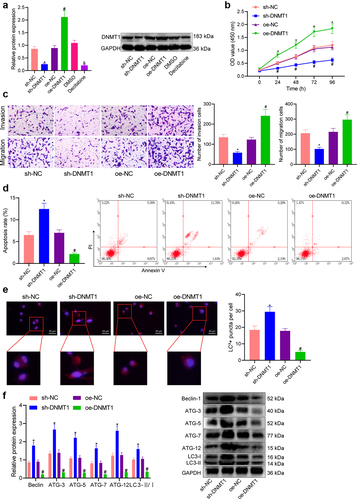
Figure 3. DNMT1 affects the binding of HSPB8 and BAG3 through modulating HSPB8 methylation. a: Methprimer software analysis of the degree of methylation near − 1000 bp upstream the promoter of HSPB8; b: MeDIP measurement of the degree HSPB8 methylation in three melanoma cell lines (A375, SK-MEL-1 and SK-MEL-28) and two human normal melanocytes (PIG1 and HEMn-LP) cell lines; c: Western blot analysis of HSPB8 protein expression in three melanoma cell lines (A375, SK-MEL-1 and SK-MEL-28) and two human normal melanocytes (PIG1 and HEMn-LP) cell lines; d: MeDIP measurement of the degree of HSPB8 methylation in Decitabine-treated SK-MEL-28 cells; e: Western blot measurement of HSPB8 protein expression in Decitabine- or sh-DNMT1-treated SK-MEL-28 cells; f: Immunofluorescence staining to detect the co-localization of HSPB8 and BAG3 in SK-MEL-28 cells (blue: DAPI; red: HSPB8); g: Co-IP detection of the binding of HSPB8 and BAG3 (IgG as a negative control; Input represented 10% total protein). h: Methylation status of HSPB8 promoter detected in SK-MEL-28 cells (M: methylation-specific primer amplification; U: unmethylation-specific primer amplification). All experiments were repeated three times. Measurement data were characterized as mean ± SD. The comparison between data of two groups was performed by independent sample t test, and that among multiple groups was performed utilizing one-way ANOVA with Tukey’s post-hoc test. *p < 0.05 versus the Normal group, HEMn-LP cells, or DMSO group. #p < 0.05 versus the sh-NC group.
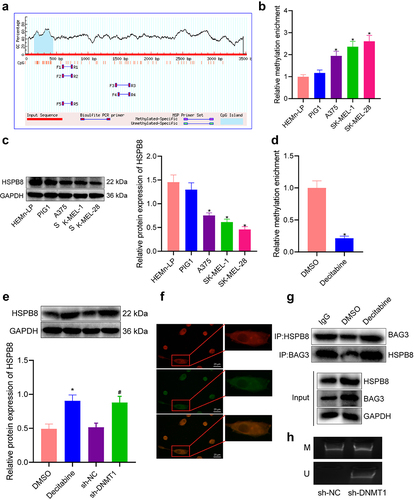
Figure 4. Knockdown of DNMT1/HSPB8 affects the viability, migration, invasion, apoptosis, and autophagy of melanoma cells. a: Western blot measurement of the protein expression of DNMT1, HSPB8 and BAG3 in SK-MEL-28 cells upon treatment with sh-DNMT1 alone or in combination with sh-HSPB8; b: CCK-8 assay to detect the viability of SK-MEL-28 cells upon treatment with sh-DNMT1 alone or in combination with sh-HSPB8; c: Transwell assay to detect the migration and invasion of SK-MEL-28 cells upon treatment with sh-DNMT1 alone or in combination with sh-HSPB8; d: Flow cytometry to detect the apoptosis of SK-MEL-28 cells upon treatment with sh-DNMT1 alone or in combination with sh-HSPB8; e: Immunofluorescence staining to observe the formation of autophagic flux in SK-MEL-28 cells upon treatment with sh-DNMT1 alone or in combination with sh-HSPB8; f: Western blot measurement of the expression of autophagy-related proteins (Beclin, ATG-3-12 and LC3-II/I) in SK-MEL-28 cells upon treatment with sh-DNMT1 alone or in combination with sh-HSPB8. Measurement data were characterized as mean ± SD. The comparison between data of two groups was performed by independent sample t test, and that among multiple groups was performed utilizing one-way ANOVA with Tukey’s post-hoc test. Comparison among data at different time points was performed using repeated measures ANOVA with Tukey’s post-hoc test. All experiments were repeated three times. *p < 0.05 versus the sh-NC + sh-NC group. #p < 0.05 versus the sh-DNMT1 + sh-NC group.
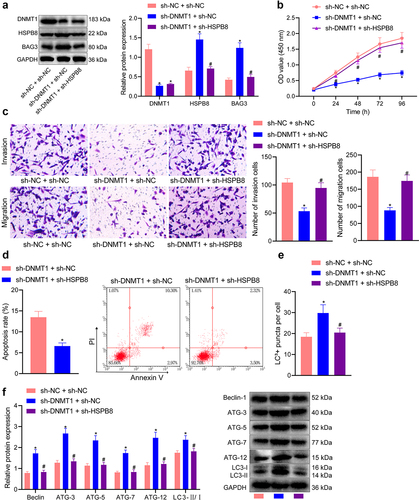
Figure 5. Overexpression of BAG3 regulates the PI3K/AKT/mTOR pathway to affect the bioactivities of melanoma cells. a: Western blot measurement of phosphorylation of mTOR (Ser2448), p70S6 (ser389) and AKT (ser473) in three melanoma cell lines (A375, SK-MEL-1 and SK-MEL-28) and two human normal melanocytes (PIG1 and HEMn-LP) cell lines; b: Western blot measurement of the phosphorylation of mTOR, p70S6, and AKT (ser473) in SK-MEL-28 cells in response to BAG3 overexpression alone or in combination with PI3K activator; c: CCK-8 detection of SK-MEL-28 cell viability in SK-MEL-28 cells in response to BAG3 overexpression alone or in combination with PI3K activator; d: Transwell assay to detect the migration and invasion of SK-MEL-28 cells in response to BAG3 overexpression alone or in combination with PI3K activator; e: Flow cytometry to detect the apoptosis of SK-MEL-28 cells in response to BAG3 overexpression alone or in combination with PI3K activator; f: Immunofluorescence staining to detect the formation of autophagic flux in SK-MEL-28 cells in response to BAG3 overexpression alone or in combination with PI3K activator; g: Western blot measurement of autophagy-related proteins in SK-MEL-28 cells in response to BAG3 overexpression alone or in combination with PI3K activator. Measurement data were characterized as mean ± SD. The comparison between data of two groups was performed by independent sample t test, and that among multiple groups was performed utilizing one-way ANOVA with Tukey’s post-hoc test. Comparison among data at different time points was performed using repeated measures ANOVA with Tukey’s post-hoc test. All experiments were repeated three times. *p < 0.05 versus the HEMn-LP cells or the oe-NC + DMSO group. #p < 0.05 versus the oe-BAG3 + DMSO group.
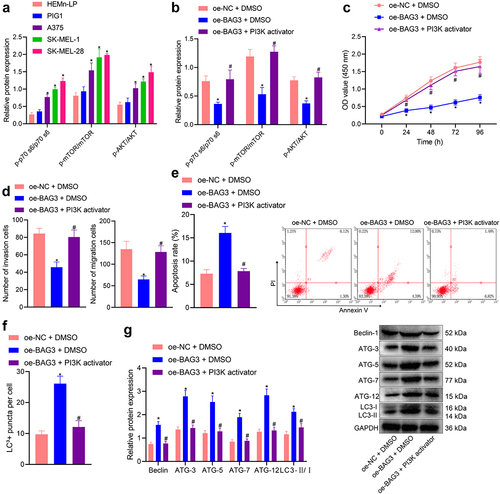
Figure 6. Knocking down DNMT1/HSPB8 affects the tumorigenesis of melanoma cells in nude mice. a: Western blot measurement of the phosphorylation of mTOR, p70S6 and AKT (ser473) in melanoma tumour tissues of nude mice treated with sh-DNMT1 alone or in combination with sh-HSPB8; b: Images of tumour xenografts in nude mice inoculated with SK-MEL-28 cells treated with sh-DNMT1 alone or in combination with sh-HSPB8; c: Weight of tumour xenografts in nude mice inoculated with SK-MEL-28 cells treated with sh-DNMT1 alone or in combination with sh-HSPB8; d: Growth curve of tumour xenografts in nude mice inoculated with SK-MEL-28 cells treated with sh-DNMT1 alone or in combination with sh-HSPB8; e: Western blot measurement of autophagy-related proteins (Beclin, ATG-3-12, and LC3-II/I) in melanoma tumour tissues of nude mice inoculated with SK-MEL-28 cells treated with sh-DNMT1 alone or in combination with sh-HSPB8. n = 6. Measurement data were characterized as mean ± SD. The comparison between data of two groups was performed by independent sample t test, and that among multiple groups was performed utilizing one-way ANOVA with Tukey’s post-hoc test. Comparison among data at different time points was performed using repeated measures ANOVA with Tukey’s post-hoc test. *p < 0.05 versus the sh-NC + sh-NC group. #p < 0.05 versus the DNMT1 + sh-NC group.
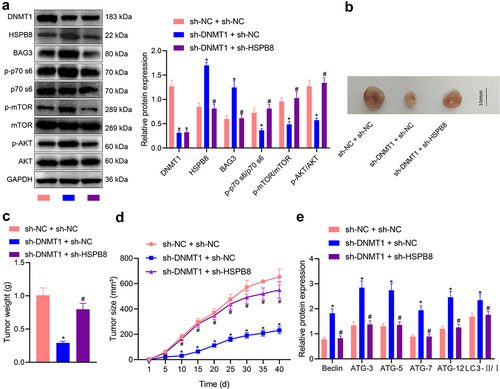
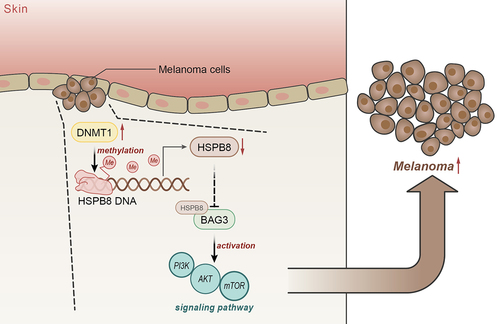
Figure 7. The mechanism graph of the regulatory network and function of DNMT1 in melanoma. DNMT1 enhances the malignant behaviours of melanoma cells and inhibits melanoma cell apoptosis and autophagy via the activation of the PI3K/AKT/mTOR pathway through repressing the binding between HSPB8 and BAG3.