
Figures & data
Figure 1. Histogram of Age Distribution of Samples. Age distribution of cow samples used in the study.
Figure 2. Epigenetic age and state of cows. (a) Models were generated using elastic net regression. (b). The Epigenetic Pacemaker was used to predict epigenetic states of the bovine samples. The trend line was fit using a non-linear function.
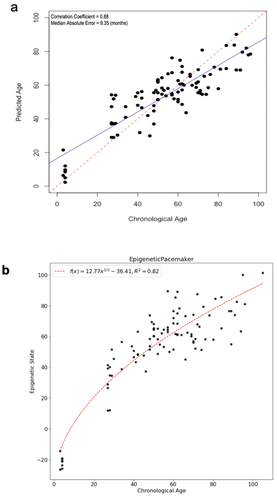
Figure 3. Epigenome-wide association results for age. Manhattan plot representing epigenome-wide association results for age. 8408 CpG sites were included. CpG sites are plotted on the x-axis ordered by position and the y-axis shows the -log10(p) of the association.
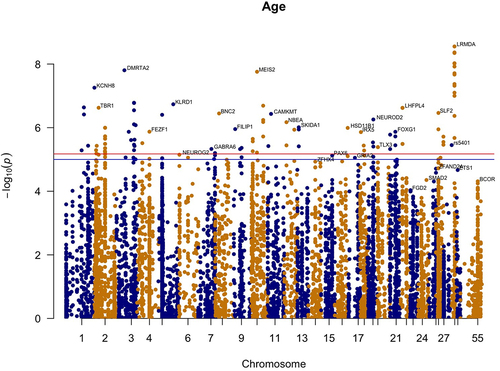
Table 1. Bovine Epigenetic clocks.
Table 2. Top Significant genes for Age.
Table 3. Age.
Figure 4. Epigenome-wide association results for milk production. Manhattan plot representing epigenome-wide association results for milk production. CpG sites are shown on the x-axis ordered by position and the y-axis shows the -log10(p) for the association.
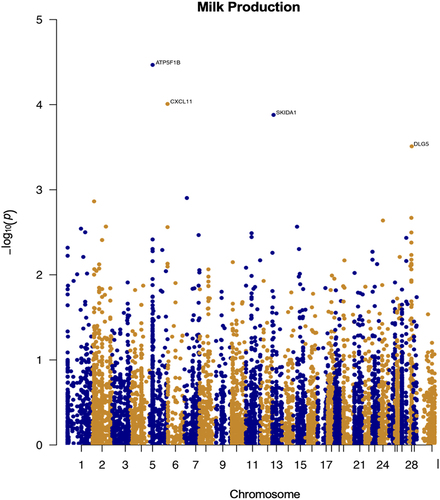
Table 4. Number of samples for each trait.
Table 5. Top Significant genes for Milk Production.
Table 6. Milk Production.
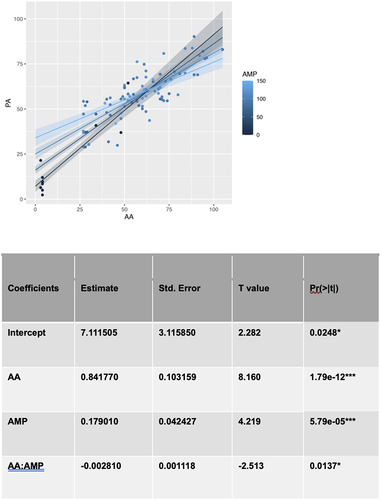
Figure 5. Moderation Analysis. a regression model of predicted age using three variables: Actual Age(AA), Actual Milk Production(AMP) and the product of actual age and actual milk production(AA*AMP). Regression lines are shown for different levels of milk production.
Supplemental Material
Download Zip (9.9 MB)Data availability statement
The authors confirm that the data supporting the findings of this study are available within the article and its supplementary materials https://drive.google.com/drive/folders/1HHmLP6ElTVcbjZw9bbdEQcP2ak2Fa3-x?usp=sharing.