
Figures & data
Table 1. RT-Qpcr primer sequences.
Table 2. CUT & RUN qPCR primer sequences.
Figure 1. BV2 Immortalized microglia robustly regulate gene expression and histone acetylation to LPS treatment. (a) RT-qPCR assessment of gene expression of Il-6, Tnfa, and Il-1b in BV2 microglia treated with different LPS doses of 10, 100, or 500 ng/mL for 3 h. Shown as bar graph of Log2(Fold Change) ± SEM Dunnett’s post hoc significances denoted (***p < 0.0002, ****p < 0.0001). (b) RT-qPCR assessment of gene expression of Il-6, Tnfa, Il-1b, Il-10, Cxcl16, Arg1, and Nos2 of BV2 microglia treated with 10 ng/mL LPS for 1, 3, 6, or 24 h. Shown as bar graph of Log2(Fold Change) ± SEM Dunnett’s post hoc significances denoted (*p < 0.03, **p < 0.002, ***p < 0.0002, ****p < 0.0001). (c) Global histone modifications by flow cytometry. Events are gated for cell size on side scatter (SSC) Area vs Forward Scatter (FSC) height and singlets on FSC-height vs FSC-width. The cells that are positive for the histone mark signal are gated based on an FMO in the same channel. The median fluorescence intensity of the positive population is exported for downstream analysis. Median fluorescent intensity (MFI) for global levels of H3K27ac levels as measured by intracellular flow cytometry. Fold Change ± SEM. Dunnett’s post hoc significances denoted (*p < 0.05, **p < 0.007, ***p < 0.0005, ****p < 0.0001). n = 2–7 replicates per condition from at least two independent sets of cultures.
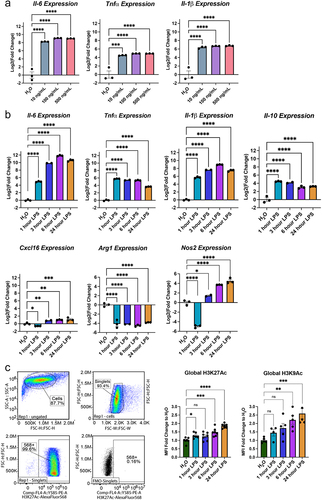
Figure 2. Hdac inhibition modulates LPS regulated gene expression. (a) Experimental design for testing the role of Hdacs in modulating lipopolysaccharide (LPS) regulated gene expression in BV2 cultures. For all subsequent panels DMSO control is shown in blue, RGFP966 shown in red, SAHA in purple and Romidepsin in green. Each gene is depicted as three panels – DMSO vs. RGFP966, DMSO vs. SAHA, and DMSO vs. Romidepsin. (b) Il-1b, (c) Il10 and (d) Cxcl16 gene expression are enhanced by Hdac3 inhibition but not by Hdac1/2 inhibition (e) Tnfα expression is unaltered by Hdac3 inhibition but reduced by Hdac1/2 inhibition (f) Il6 expression is enhanced by Hdac3 inhibition at baseline but not in response to LPS. (g) RGFP966 blocks Arg1 repression after LPS treatment. Hdac1/2 inhibition results in the repression of Arg1 gene expression (h) Nos2 expression is increased moderately by RGFP966 both at baseline and in response to LPS. SAHA results in blunted gene expression at baseline and in response to LPS Romidepsin results blunting of Nos2 gene expression at baseline but not in response to LPS. Each panel is Log2 fold change relative to DMSO H2O and error bars are ± SEM. In all panels DMSO H2O versus DMSO LPS significance is not shown, but reaches statistical threshold (*p < 0.05) for all genes. n = 4–6 per condition in at least 3 independent cultures. *p < 0.05, **p<0.01, ***p < 0.001, ****p < 0.0001.
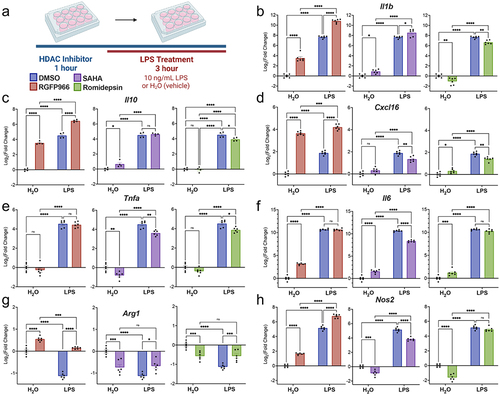
Figure 3. Changes in cytokine release and global histone acetylation upon Hdac inhibition. (a) BV2 microglial cells were treated with DMSO, RGFP966, SAHA or Romidepsin for 1 hour and then H2O or LPS was added for 24 hours. Media was harvested for cytokine protein level assessment. Cells were then harvested, and intracellular staining was performed for H3K9ac or H3K27ac. LEGENDplex immunoassay levels of cytokine (b) Tnfα shows no impact of Hdac3 inhibition in combination with LPS. (c) Il6 protein levels were enhanced in response to Hdac3 inhibition at baseline. Graphs are depicted as log2fold change relative to DMSO H2O treated samples. n = 6 per treatment in 3 independent replication experiments. Tukey’s corrected posthocs *p < 0.05, **p < 0.005, ***p < 0.001, ****p < 0.0001. (d) Global levels of H3K27ac were increased with RGFP966, SAHA, and Romidepsin at baseline and upon LPS treatment. (e) Global levels of H3K9ac were significantly increased with RGFP966, SAHA and Romidepsin at baseline and upon LPS treatment. MFI: median fluorescence intensity. Fold change is relative to DMSO treated water samples. n = 9 per treatment in 3 independent cultures. Tukey’s corrected posthocs *p < 0.05, **p < 0.005, ***p < 0.001, ****p < 0.0001.
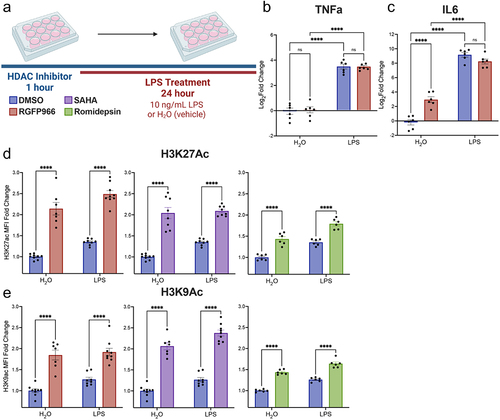
Figure 4. Histone acetylation changes at Hdac3 modulated genes. (a) Experimental design for CUT&RUN qPCR analysis of H3K27ac and H3K9ac over promoters of key Hdac regulated target genes. All samples are normalized to yeast spike in and expressed as a percentage of input sample based on standard curve. Signal then calculated as fold enrichment relative to the H3K27ac or H3K9ac antibody levels in the DMSO and water treated control. DMSO and RGFP966 non-immune IgG samples were included for all experiments (b) H3K27ac and H3K9ac signal is significantly increased over the Cxcl16 promoter with RGFP966 treatment. (c) Trends for increased H3K27ac and H3K9ac signal with RGFP966 over the Il1-b promoter. (d) H3K27ac signal is significantly increased over the Arg1 promoter with RGFP966 treatment. H3K9ac shows similar trends but did not reach significance. (e) H3K27ac signal is significantly increased over the Nos2 promoter with RGFP966 and LPS treatment. H3K9ac shows similar trends but did not reach significance. All plots are fold enrichment with ± SEM. n = 3 per condition in independent cultures. *p < 0.05.
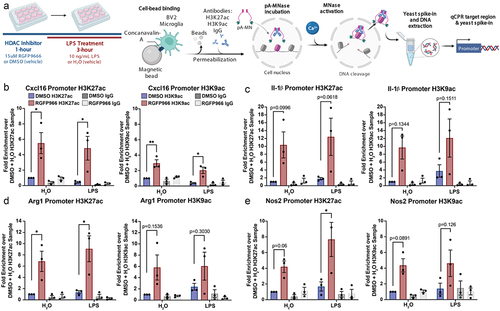
Figure 5. Hdac inhibition enhances microglial phagocytosis in a Nitric Oxide dependent matter. (a) Experimental design for phagocytosis assay and NO Assay. Media was collected for NO measurement prior to bead addition for phagocytosis. pHrodo beads were added for 1 hour and the percent of cells engulfing pHrodo beads was quantified by flow cytometry (b) Schematic of how Nω-Nitro-L-arginine methyl ester hydrochloride (L-NAME) acts as a Nos inhibitor of which inhibits NO production and the predicted impacts on phagocytosis. (c) Example phase contrast and fluorescent images depicting enhanced bead engulfment by RGFP966 treatment at baseline and in response to LPS. Engulfed beads are shown in red. (d) Hdac3 inhibition blunts NO production in response to LPS. (e) Hdac3 inhibition enhances the percent of cells engulfing beads both at baseline and in response to LPS. (f) L-NAME blunts NO release in response to LPS and removes the impact of Hdac3 inhibition (g) L-NAME eliminates the impact of Hdac3 inhibition on phagocytosis following LPS treatment, but not at baseline. Mean ± SEM. n = 5–6 from 3 independent cultures *p < 0.05, **p<.01, ***p < 0.001, ****p < 0.0001.
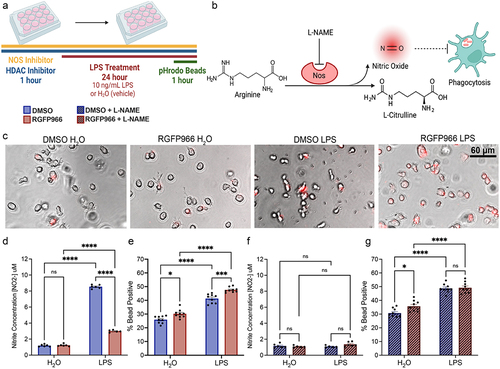
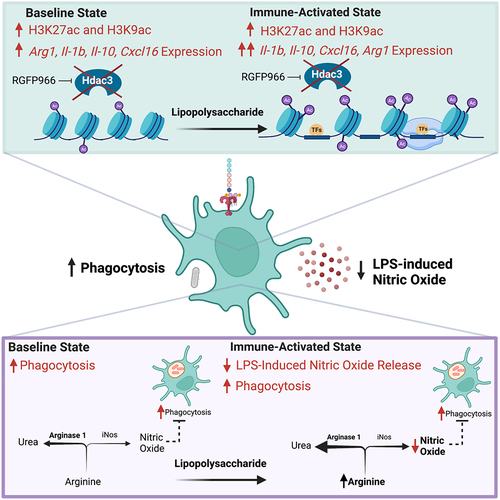
Figure 6. Model for Hdac3 regulation of LPS-mediated gene expression and function in microglia. Hdac3 represses baseline gene expression through deacetylation of H3K27ac and H3K9ac marked histones. Upon LPS stimulation Hdac3 releases, allowing for increased histone acetylation and immune activation. In the presence of RGFP966, Hdac3’s deacetylase activity is blocked, allowing for increased histone acetylation at baseline and an aberrant increase in baseline gene expression. LPS treatment combined with inhibition of Hdac3 results in hyper-induction of Hdac3 target genes and a lack of suppression of genes normally repressed by LPS. These gene expression shifts ultimately culminate in repressed NO release and increased phagocytosis, driving microglia towards a phenotype that promotes debris clearance. Hdac3 inhibition may drive the changes in NO and phagocytosis through modulation of arginine usage in response to LPS by increasing Arg1 expression and pushing the reaction away from NO generation.
Supplemental Material
Download MS Excel (31.9 KB)Data availability statement
All datasets are available as raw data upon request to the authors.