
Figures & data
Table 1. Summary information of the participants.
Figure 1. Sperm sncRNA expression from fresh frozen sperm samples of TGCT patients and control men. (a) Principal components analysis performed with all samples. (b) Small RNA length distributions of one representative TGCT patient, one representative non-TGCT man and the outlier TGCT patient n°10. (c) Pie chart representation of sncRNA population in control patients and control men, as indicated. Mean values are indicated in %. No statistical significance was found in the different sncRNA population between the TGCT and non-TGCT groups. (d) Heat map of a supervised hierarchical clustering based on the 100 most expressed sncRnas. In the heat map orange indicates relative high expression and blue indicates relative low expression. The coloured squares above the graph designate TGCT and non-TGCT samples. (e) Principal components analysis performed without patient n°10.
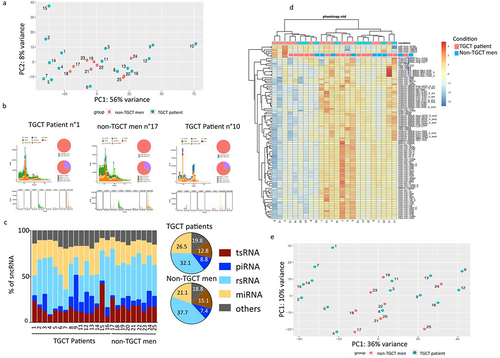
Figure 2. Influence of sperm motility on sperm sncRNA profiles. (a) Principal components analysis performed on TGCT patients with low semen quality (low TGCT patient) according to WHO standard semen analysis and non-TGCT men (b) IPA analysis performed with the sncRnas deregulated in low semen quality compared to non-TGCT men shows the deregulation of several pathways involved in cancer; Orange and blue symbols represent downregulated and upregulated pathways. Orange edges: relationships predicted as activating. Blue edges: relationship predictive as inhibitory. (c) Principal components analysis performed with TGCT patients and non-TGCT men, both groups characterized by normal semen quality, according to WHO standard semen analysis. (d) Heat map of a supervised hierarchical clustering based on the significantly differentially expressed sncRnas fragments (padj <0.1). In the heat map orange indicates relative high expression and blue indicates relative low expression. The coloured squares above the graph designate TGCT and non-TGCT samples. (e) Abundance of differentially expressed sncRnas, Mann–Whitney test were applied to calculate the p-values (indicated above each comparison).
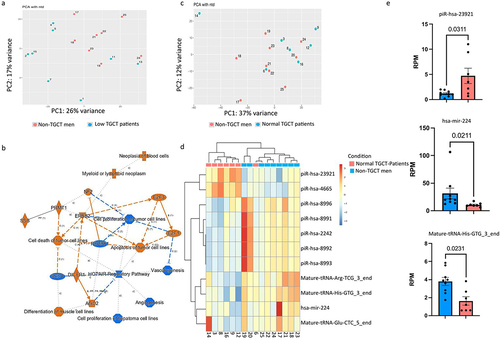
Table 2. Summary information of the selected participants based on their physiological sperm parameters.
Supplemental Material
Download Zip (1.2 MB)Data availability statement
The data that support the findings of this study are available from the corresponding author (VG) upon reasonable request. SRA Database with accession number (PRJNA862464).