
Figures & data
Figure 1. Variation in the distribution of mtDNA methylation across bovine preimplantation development.
Figure 2. Average methylation levels per stage displayed together with average mitochondrial expression of the 4 representative transcripts selected for this study (ND6, CYTB, Trna-Phe and Trna-Gln). Values are represented as mean ± S.E.M.
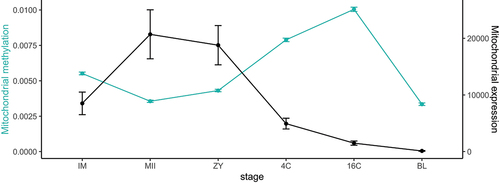
Figure 3. (a) Heatmap shows the average methylation difference in the gene regions between consecutive stages and considering all cytosine contexts (CG, CHG and CHH). (b) Heatmap shows the average methylation difference in the regions encoding tRnas between consecutive stages and considering all cytosine contexts (CG, CHG and CHH). Red colour indicates an increase of methylation between the two consecutive stages, blue colour indicates a decrease of methylation between the two consecutive stages, light colour indicates no changes between the two consecutive stages.
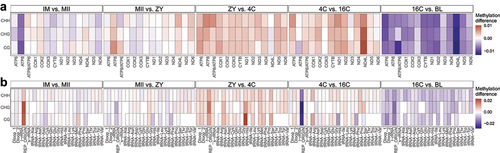
Figure 4. (a) Methylation level observed at the replication origin of the light strand in mitochondrial DNA. (b) mtDNA copy number calculated per structure or (C) per cell. ![]()
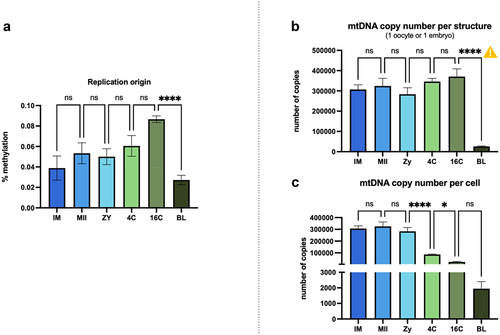
Figure 5. Methylation levels and the relationship with mitochondrial expression of the light strand. (a) methylation profile observed at D-loop region for all stages; (b) methylation levels at the ND6 encoding region and (c) the number of ND6 transcripts for all stages; (d) methylation levels at the Trna-Gln encoding region and (e) the number of Trna-Gln transcripts for all stages. Methylation levels are presented as percentages. Consecutive stages were compared using ANOVA + Fisher’s LSD considering an α = 5%. *represents p < 0.05; **represents 0 < 0.001, ***represents p < 0.0001.
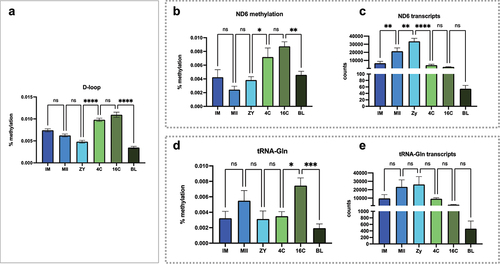
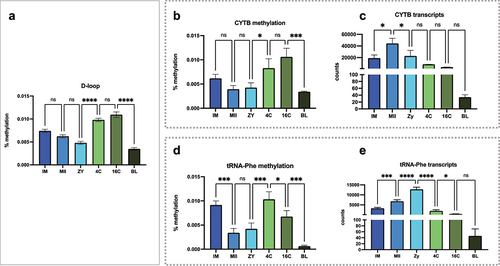
Figure 6. Methylation levels and the relationship with mitochondrial expression of the heavy strand. (a) methylation profile observed at D-loop region; (b and c) methylation levels at the CYTB encoding region and the number of CYTB transcripts; (d and e) methylation levels at the Trna-Phe encoding region and the number of Trna-Phe transcripts. Consecutive stages were compared using ANOVA + Fisher’s LSD considering an α = 5%.
Supplemental Material
Download MS Word (48.4 KB)Data availability statement
Data supporting the findings of this study have been deposited in the National Center for Biotechnology Information (NCBI) and are accessible through GEO Series Accession number GSE230476.