
Figures & data
Figure 1. Construction a transcriptome-wide map of m6A mRnas identified in the peripheral blood of healthy controls and IPAH patients. (a) the m6A content in total RNA form the peripheral blood of CON group and IPAH group. (b) Venn diagram showing the number of methylated m6A sites in CON and IPAH. (c) Pie chart showing the proportion of differentially methylated m6A sites in the five transcriptional sequences-5’UTR, 3’UTR, stop codon, start codon, CDs. (d) Bar chart showing the distribution of differentially methylated m6A sites on chromosomes 1–22 and sex chromosomes. (e) Relative density of DMMSs in each chromosome normalized by length of the respective chromosome. Orange, upmethylated m6A sites in IPAH patients; Green, downmethylated m6A sites in IPAH patients.
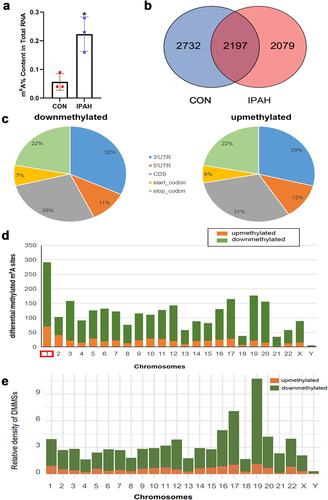
Table 1. Total numbers of differentially methylated N6-methyladenosine sites and associated genes.
Figure 2. Function annotations of genes containing DMMSs. (a) Top 10 biological processes and molecular function of differentially downmethylated genes. (b) Top 10 biological processes and molecular function of differentially upmethylated genes. (c) Top 10 pathway analysis of differentially downmethylated genes. (d) Top 10 pathway analysis of differentially upmethylated genes.
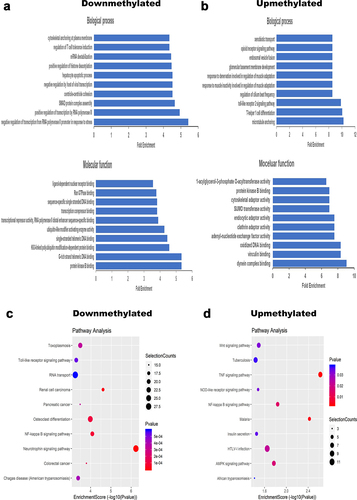
Table 2. Biological process of downregulated m6A methylation.
Table 3. Biological process of upregulated m6A methylation.
Table 4. Molecular function of downregulated m6A methylation.
Table 5. Molecular function of upregulated m6A methylation.
Table 6. KEGG pathway analysis of downregulated m6A methylation.
Table 7. KEGG pathway analysis of upregulated m6A methylation.
Figure 3. Conjoint analysis of differentially methylated and differentially expressed genes. (a) Scatter diagram showing the number of differentially expressed genes (fold change ≥ 2, P<0.05 and FPKM ≥ 0.1 at least one sample). (b) Venn diagram showing the differentially expressed genes containing DMMSs. (c) Ten hub genes identified by cytoHubba in the development of IPAH. (d) m6A enrichment of SMAD3, TP53, RPS27A and FoxO3 mRNA in the peripheral blood of CON group and IPAH group. (e) the mRNA expression levels of SMAD3, TP53, RPS27A and FoxO3 were measured in the peripheral blood of CON group and IPAH group. *P<0.05 (different from CON),**P<0.01 (different from CON), ****P<0.0001 (different from CON).
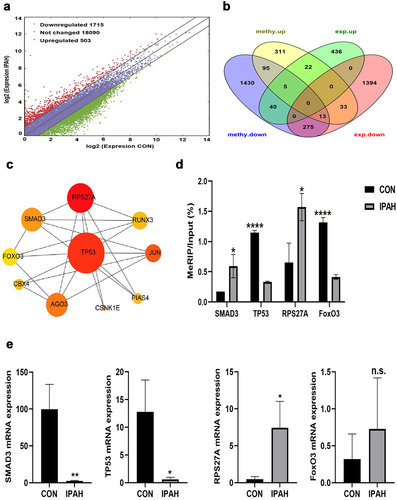
Figure 4. The identification of hypoxia-induced pulmonary arterial hypertension rat model. (a) RVSP and the ratio of RV/(LV + S) were measured in Normoxia group and Hypoxia group. (b) H&E staining was performed in the lung of Normoxia group and Hypoxia group. scale bar = 50 μm. Quantitative measurement of media thickness of pulmonary artery (c) and vessel muscularization (d). Data are present as means±SD (n = 6 rats in per group). *P<0.05 (different from Normoxia group), **P<0.01 (different from Normoxia group), ***P<0.001 (different from Normoxia group), ****P<0.001 (different from Normoxia group).
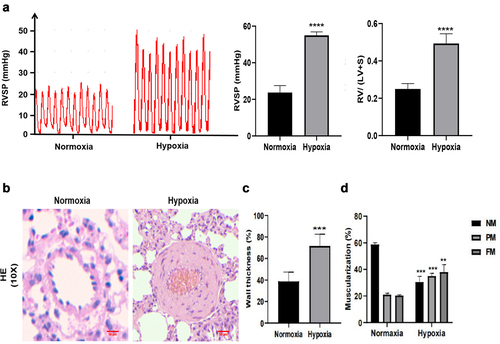
Figure 5. The identification of MCT-induced pulmonary arterial hypertension rat model. (a) RVSP and the ratio of RV/(LV + S) were measured in Control group and MCT group. (b) H&E staining was performed in the lung of Control group and MCT group. scale bar = 50 μm. Quantitative measurement of media thickness of pulmonary artery (c) and vessel muscularization (d). Data are present as means±SD (n = 3 rats per group). *P<0.05 (different from Control group), **P<0.01 (different from Control group), ***P<0.001 (different from Control group).
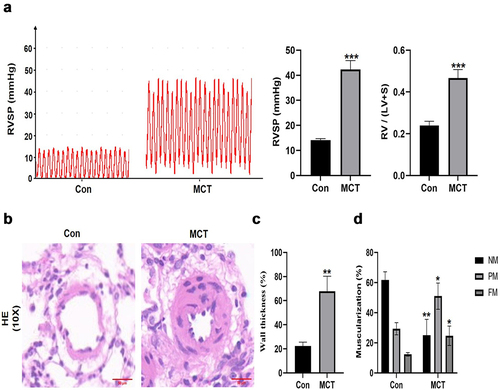
Figure 6. The expression of major m6A-related proteins in Hypoxia group and Normoxia group. (a) Western blot image of METTL3, FTO, ALKBH5, IGF2BP1, IGF2BP2, YTHDF1, YTHDF2. β-actin was used as an internal reference. (b) Statistical bar graph of METTL3, FTO, ALKBH5, IGF2BP1, IGF2BP2, YTHDF1, YTHDF2. Data are shown as means±SD (n = 6 rats per group). n.s.P>0.05 (different from Normoxia group), *P<0.05 (different from Normoxia group), **P<0.01 (different from Normoxia group), ***P<0.001 (different from Normoxia group).
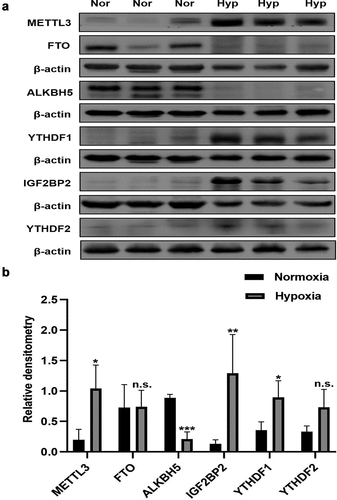
Figure 7. Immunofluorescence staining of YTHDF1 (a), IGF2BP1 (b), ALKBH5 (c) in pulmonary vessels. α-SMA (red), objective protein (green) and nucleus were dyed with DAPI (blue), scale bar = 40 μm.
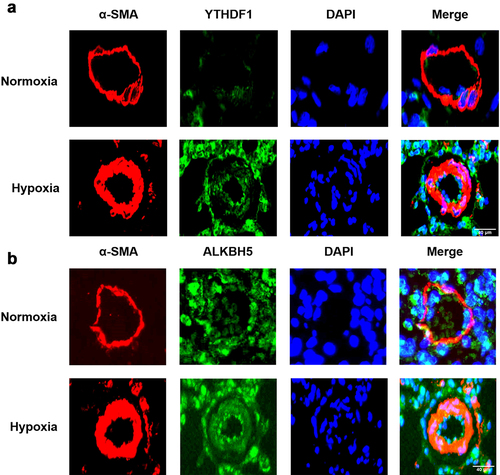
Figure 8. The expression of major m6A-related proteins in PASMCs exposed to hypoxia and PDGF-BB. (a) Western blot image of METTL3, FTO, ALKBH5, IGF2BP1, IGF2BP2, YTHDF1, YTHDF2, PCNA under hypoxia. β-actin was used as an internal reference. (b) Statistical bar graph of METTL3, FTO, ALKBH5, IGF2BP1, IGF2BP2, YTHDF1, YTHDF2, PCNA. (c) Western blot image of METTL3, YTHDF1, PCNA under PDGF-BB stimulation. β-actin was used as an internal reference. (d) Statistical bar graph of METTL3, YTHDF1, PCNA. Data are shown as means±SD (n = 3 each). n.s.P>0.05, *P<0.05, **P<0.01.
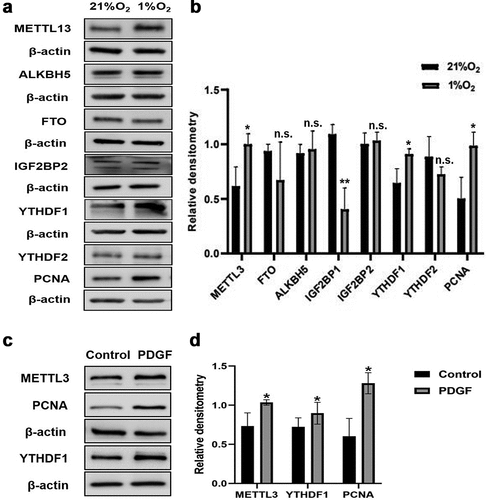
Figure 9. The protein expression of m6A-regulated genes in lungs of experimental PH rat models and PDGF-BB induced PASMCs. Representative immunoblots of TP53, SMAD3, FoxO3 and RPS27A protein expression in (a) lung tissues of hypoxia-induced pulmonary arterial hypertension rats, (b) lung tissues of MCT-induced pulmonary arterial hypertension rats and (c) PDGF-BB induced PASMCs (n = 3 per group) normalized to β-actin. Relative densitometric analysis of TP53, SMAD3, FoxO3 and RPS27A protein expression in (d) lung tissues of hypoxia-induced pulmonary arterial hypertension rats, (e) lung tissues of MCT-induced pulmonary arterial hypertension rats and (f) PDGF-BB induced PASMCs (n = 3 per group) normalized to β-actin. Data are shown as means±SD. n.s.P>0.05, *P<0.05.
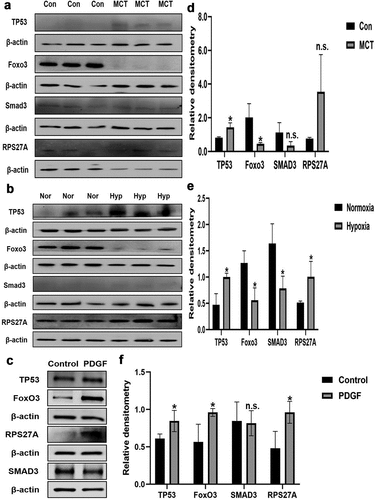
Table A2. Primers used for MeRIP-qPCR.
Table A3. Primers used for Qrt-PCR.