
Figures & data
Figure 1. FTO was upregulated in bladder cancer and was correlated with patient survival. a. Western blotting revealed that FTO expression in bladder cancer (T) and matched adjacent normal (N) tissues. b. FTO expression in bladder cancer (Tumor) and matched adjacent normal (Normal) tissues detected by IHC analysis at 200× magnification. Scale bars indicate 50 μm. c. Kaplan–Meier survival curves of overall survival based on the GEPIA database. d. FTO was considered as an independent predictor through Univariate and multivariate cox regression analysis.
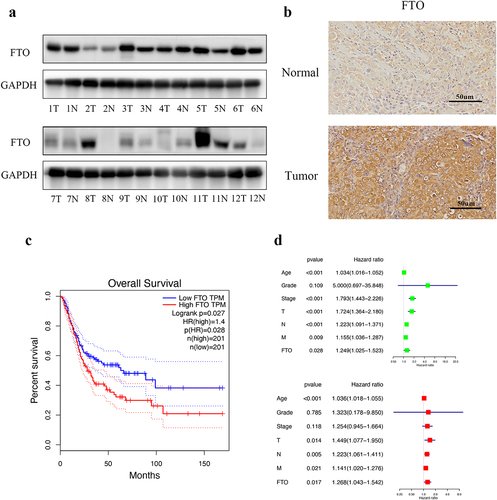
Figure 2. The overexpression of FTO promoted proliferation and migration abilities of bladder cancer. a. FTO expression was detected by western blotting after FTO overexpression in bladder cancer cells. b. Colony formation assay showed that the colony-forming ability of FTO-overexpressing cells. c and d. the proliferative ability of FTO-overexpressing cells was determined using CCK-8 (C) and EdU (D, magnification × 200, scale bars indicate 50 μm) assays. e Transwell migration assay of FTO-overexpressing cells at 100× magnification. f. Wound healing assays of FTO-overexpressing cells at 100× magnification. Scale bars indicate 100 μm. Scale bars indicate 100 μm. Data are presented as mean ± SD. *P < 0.05, **P < 0.01, and ***P < 0.001.
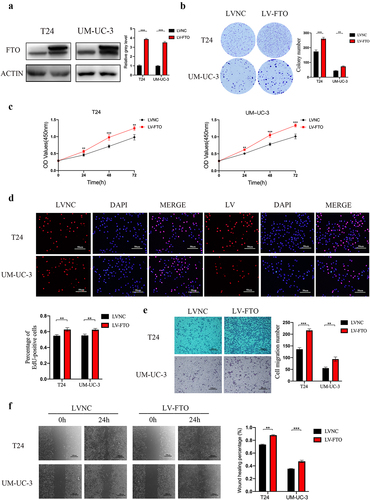
Figure 3. FTO knockdown suppressed proliferation and migration abilities of bladder cancer. a. FTO expression was detected by western blotting after FTO knockdown in bladder cancer cells. b. Colony formation assay showed that the colony-forming ability of FTO-knockdown cells. c and d. the proliferative ability of FTO- knockdown cells was determined using CCK-8 (C) and EdU (D, magnification × 200, scale bars indicate 50 μm) assays. e. Transwell migration assay of FTO-knockdown cells at 100× magnification. Scale bars indicate 100 μm. f. Wound healing assays of FTO-knockdown cells at 100× magnification. Scale bars indicate 100 μm. Data are presented as mean ± SD. *P < 0.05, **P < 0.01, and ***P < 0.001.
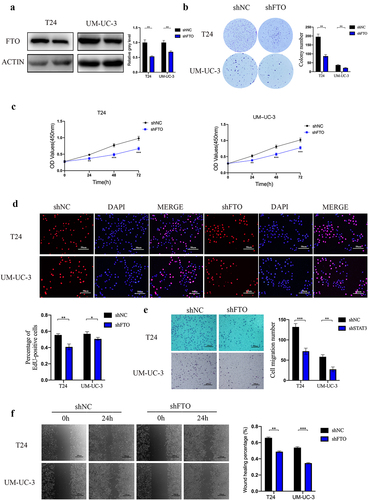
Figure 4. FTO regulated the expression of STAT3 by modulating demethylation-mediated STAT3 RNA stability. a. Correlation analysis between FTO and STAT3 expression (r = 0.52, P < 0.001) using the GEPIA database. b am=nd c. STAT3 protein and mRNA expression was detected by western blotting (B) and Qrt-PCR (C) after FTO overexpression in T24 and UM-UC-3 cells. d. STAT3 mRNA expression was detected by Qrt-PCR after FTO overexpression and simultaneous treatment with actinomycin D in T24 cells. e and f. STAT3 protein and mRNA expression was detected by western blotting (B) and Qrt-PCR (C) after FTO knockdown in T24 and UM-UC-3 cells. g. STAT3 mRNA expression was detected by Qrt-PCR after FTO knockdown and simultaneous treatment with actinomycin D in T24 cells. h. FTO mRNA expression as determined by Qrt-PCR after FTO knockdown and simultaneous treatment with or without 3-deazaadenosine (3-DAA) in T24 cells. i. m6A-modified mRNA levels in FTO-overexpressing T24 cells were measured using Qrt-PCR. j and k. P-STAT3, Bcl-2, c-Myc and CyclinD-1 protein expression level as determined by western blotting after FTO overexpression and FTO knockdown in T24 and UM-UC-3 cells. Data are presented as mean ± SD. *P < 0.05, **P < 0.01, and ***P < 0.001.
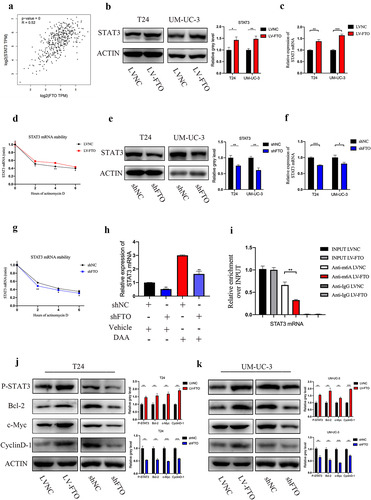
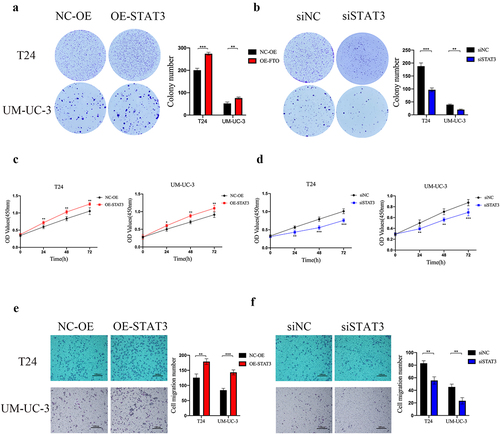
Figure 5. STAT3 served as an oncogene of bladder cancer. a and b. the colony-forming ability of STAT3 overexpressing (A) and knockdown (B) cells as determined by colony formation assay. c and d. the proliferative ability of STAT3-overexpressing (C) and knockdown (D) cells as determined by CCK-8 assay. e and f. Transwell migration assay of STAT3-overexpressing (E) and knockdown (F) cells at 100× magnification. Scale bars indicate 100 μm. Data are presented as mean ± SD. *P < 0.05, **P < 0.01, and ***P < 0.001.
Supplemental Material
Download Zip (20.5 KB)Data availability statement
The data generated in this study are available upon request from the corresponding author.